March 28, 2018
Lesson Learn – Think Think Got More Things – Black Monday October 19, 1987
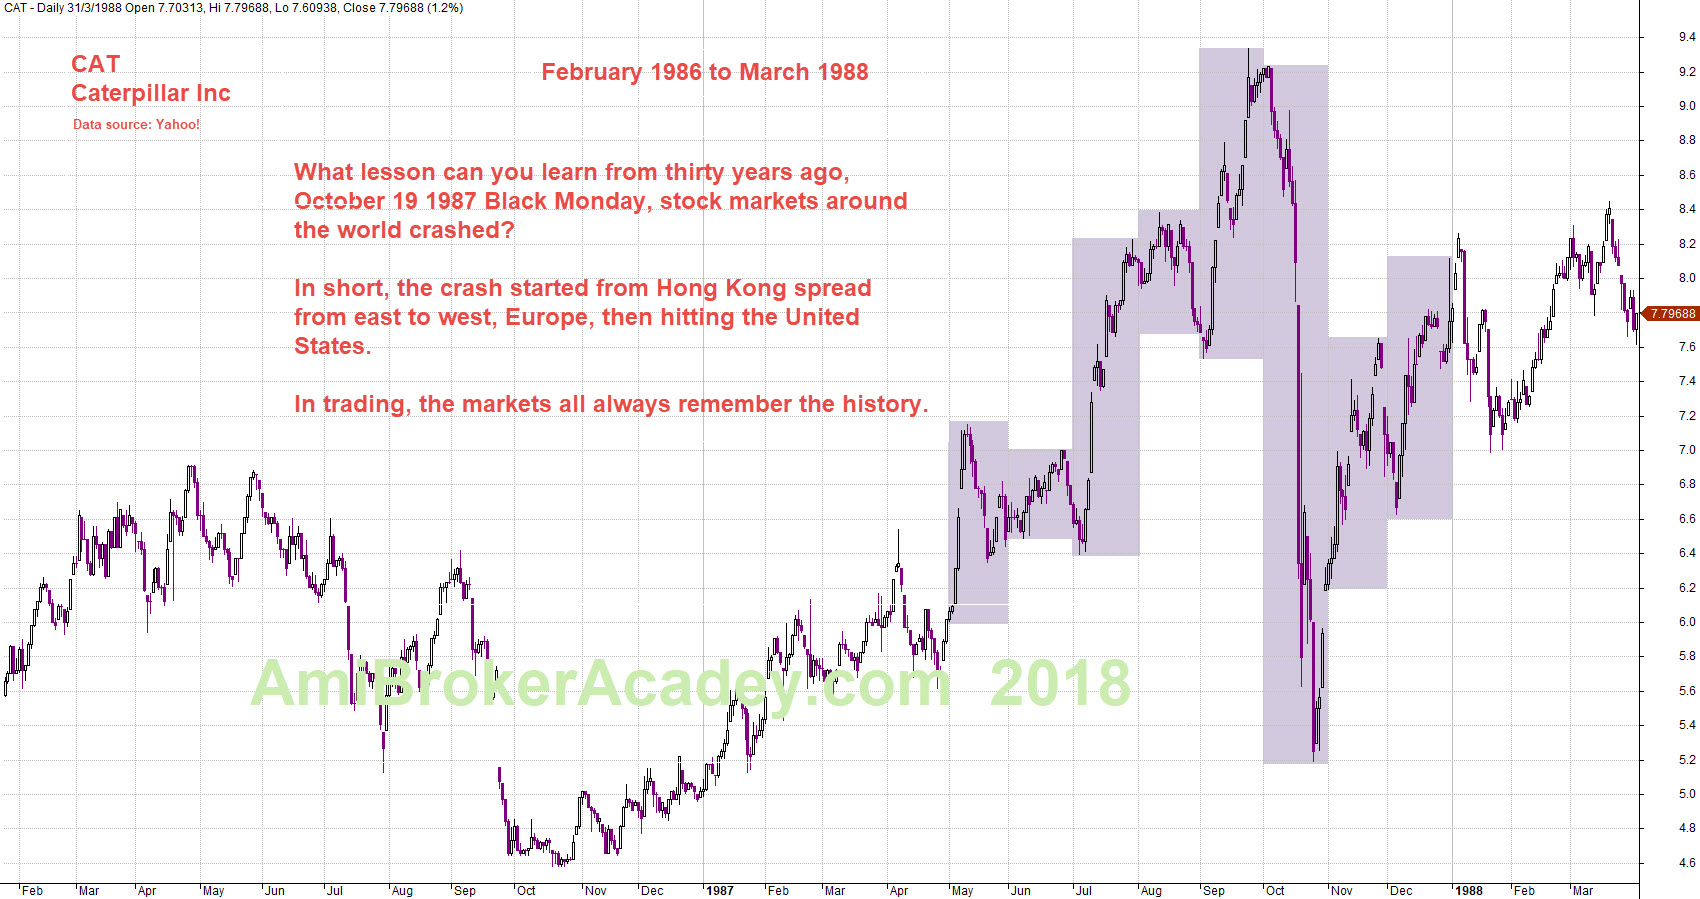
Thirty years ago, on October 19, 1987 the stock markets around the world crashed. See the chart below this was what happen to Caterpillar stock price. In financial, October 19, 1987 was named Black Monday. The crash started from East Hong Kong spread to west Europe and ended in United State.
In finance, the market always remember the history. What can you learn from the lesson? Manage your risk. The current market, the price action continue to drive higher, only until this year the market stop going any higher and start to forms lower high. The market confident begin to weaken, read the fear index chart posted. There are just too many reason for the market to feel fear. Many of the traders and investors start to sell off to cash in.
US Stock Chart Analysis
Caterpillar Inc Charting – Black Monday Crashed
Caterpillar was happy and successful from October 1986, market was confident and the stock price just too cheap. Caterpillar stock price climbed higher from 4.5 all the way to nearly touch 9.4. The market began to feel the stock price was too expensive. The stock price began to deep, the bull pushed it up again. And suddenly the sell off happen, the hard work for the past eight nine months was suddenly gone, the stock price was brought back down to the 5.2, only seventy cents away from October 1986 stock price. See the month high low for reference of the stock price movement.
Manage your risk. Avoid to buy high and sell higher.
Powerful Chart Software – AmiBroker
The following chart is produced using AmiBroker charting software. It is a powerful chart software. Anything, finance ticket you could download from Yahoo! Finance you could plot them, those you are interested all in a chart, so you could analyse them. The further you can download from Yahoo! Finance is 1970. Enjoy your learning.
March 28, 2018 Caterpillar Inc and Lesson From October 19 1987
Moses US Stock Chart Analysis
AmiBrokerAcademy.com
Disclaimer
The above result is for illustration purpose. It is not meant to be used for buy or sell decision. We do not recommend any particular stocks. If particular stocks of such are mentioned, they are meant as demonstration of Amibroker as a powerful charting software and MACD. Amibroker can program to scan the stocks for buy and sell signals.
These are script generated signals. Not all scan results are shown here. The MACD signal should use with price action. Users must understand what MACD and price action are all about before using them. If necessary you should attend a course to learn more on Technical Analysis (TA) and Moving Average Convergence Divergence, MACD.
Once again, the website does not guarantee any results or investment return based on the information and instruction you have read here. It should be used as learning aids only and if you decide to trade real money, all trading decision should be your own.