14 February, 2019
Happy Valentines Day.
Today is February 14, Valentines Day.
Welcome to AmiBrokerAcademy.com. We provide US stock analysis for academy learning.
Think!
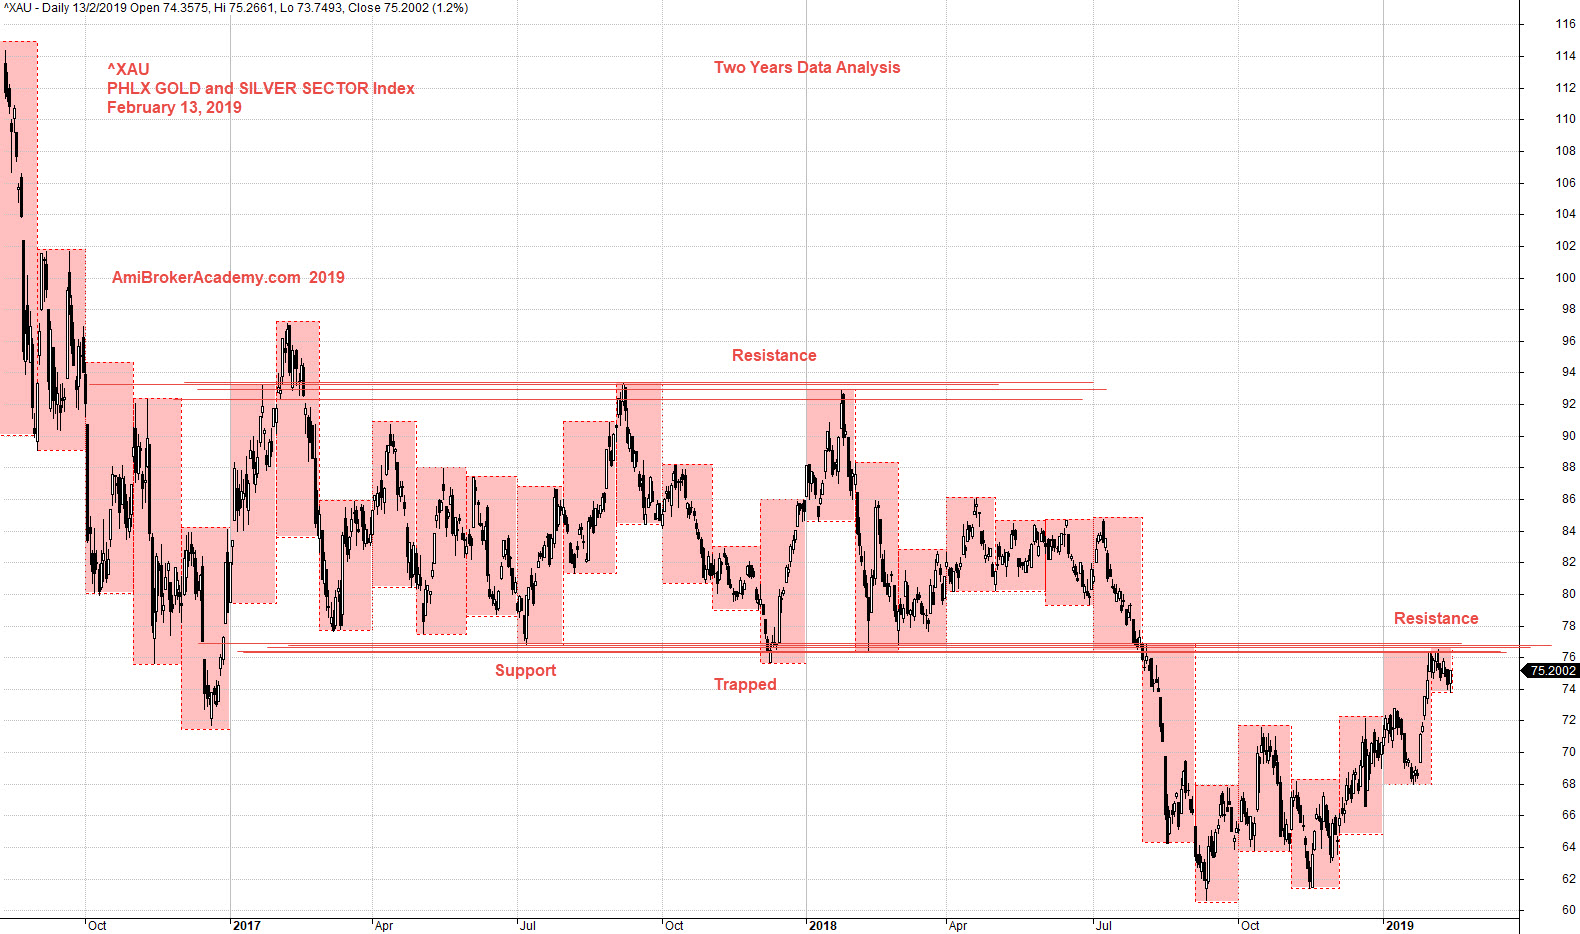
^XAU PHLX Gold and Silver Sector Index Stock Charting
Study PHLX Gold and Silver Index stock charting.
Using month high low to find the common level, or the strong level from another interpretation. Since the high low of month stop around the same level.
See chart, picture worth a thousand words. You could find the price action trapped within the two strong level.
Trade with eyes open.
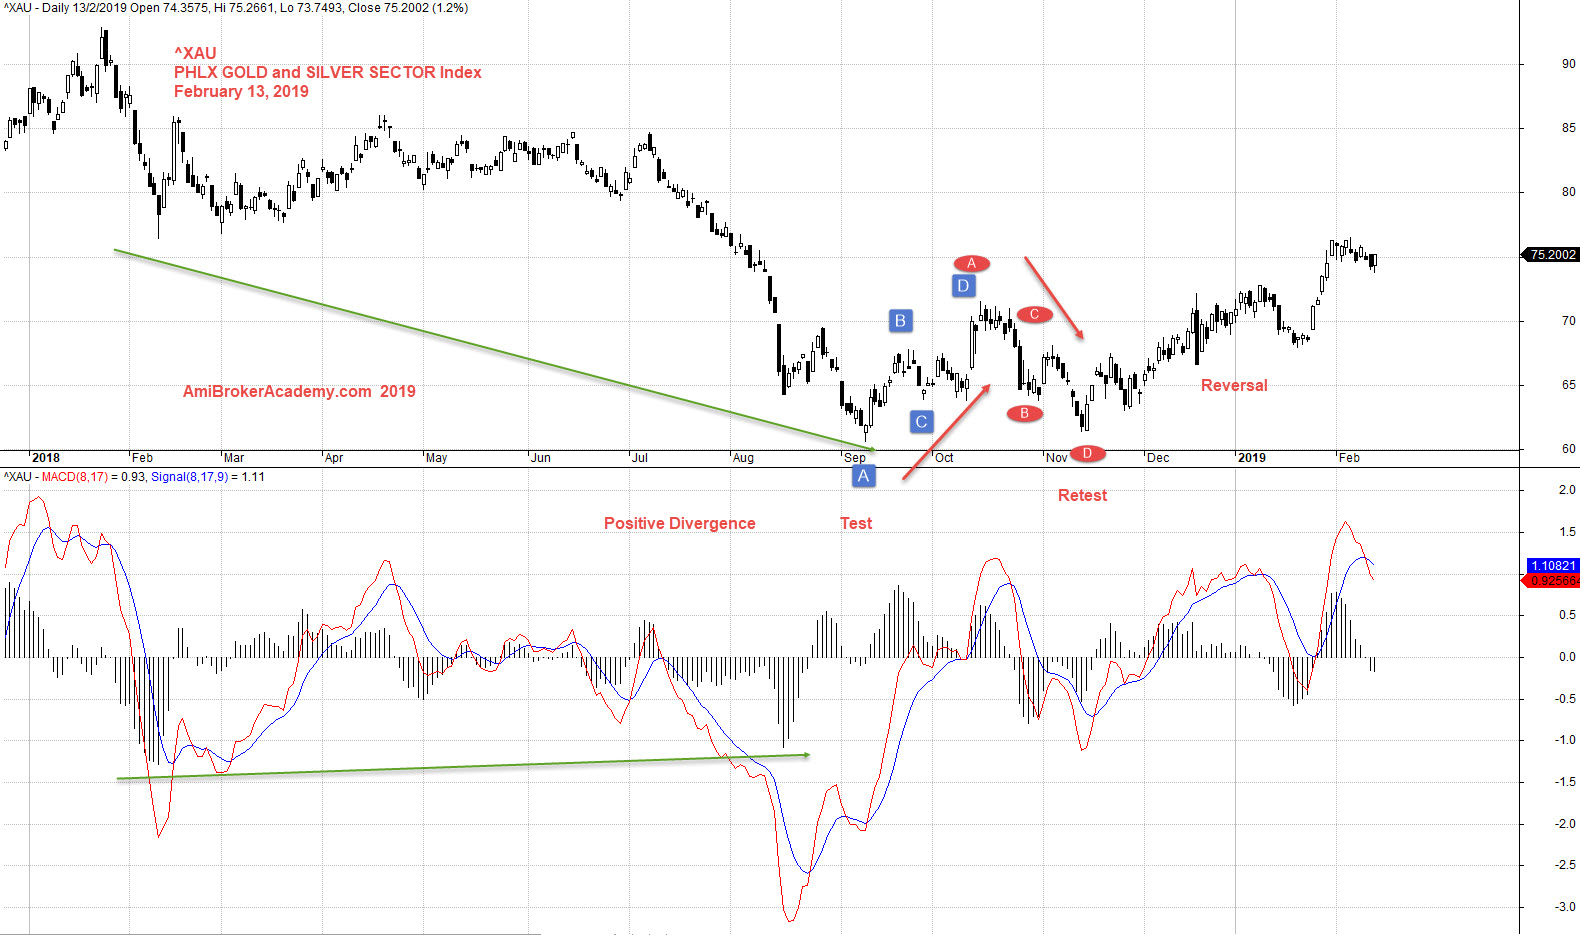
Zoom in and add the MACD indicator, you could spot a positive divergence. the price continue to go lower, but the MACD begin to form higher low. See chart, the price action after the bottom begin to rebounce.
Besides you could easily find H M Gartley pattern.
Moses Stock Analysis
AmiBrokerAcademy.com
Disclaimer
The above result is for illustration purpose. It is not meant to be used for buy or sell decision. We do not recommend any particular stocks. If particular stocks of such are mentioned, they are meant as demonstration of Amibroker as a powerful charting software and MACD. Amibroker can program to scan the stocks for buy and sell signals.
These are script generated signals. Not all scan results are shown here. The MACD signal should use with price action. Users must understand what MACD and price action are all about before using them. If necessary you should attend a course to learn more on Technical Analysis (TA) and Moving Average Convergence Divergence, MACD.
Once again, the website does not guarantee any results or investment return based on the information and instruction you have read here. It should be used as learning aids only and if you decide to trade real money, all trading decision should be your own.