February 14, 2019
Study ST Index again from a different perspective. See the analysis below.
Thanks for visit the site here. Hope you find the read interesting.
Today is February 14, Valentines Day.
Think think got more things.
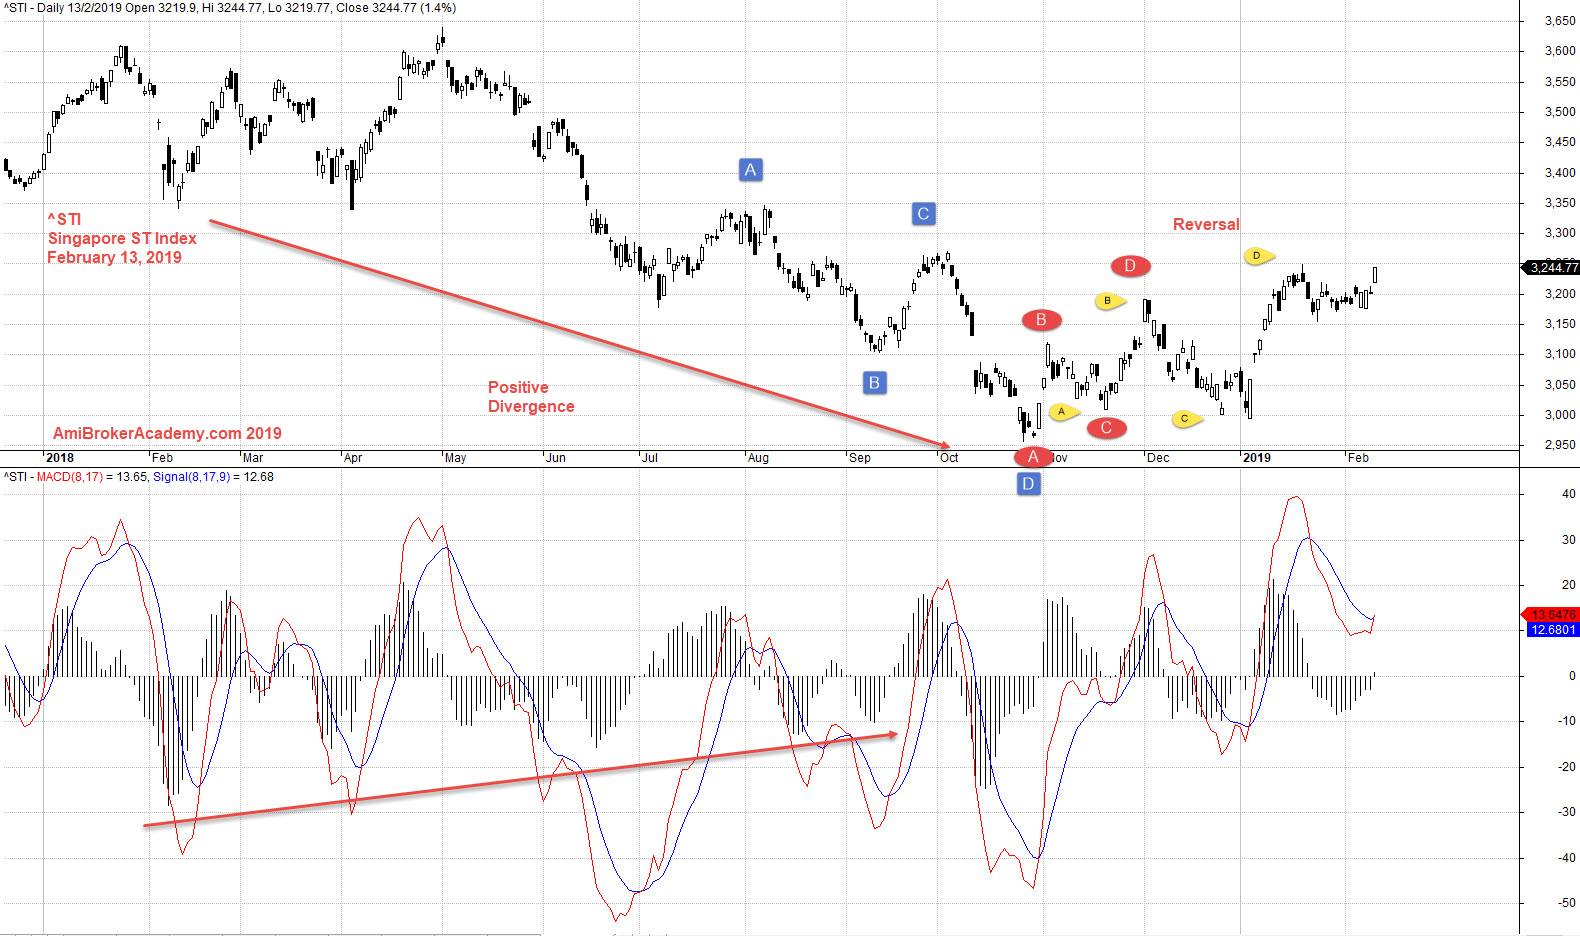
^STI ST Index Stock Charting
Study ST Index, Striats Times Index stock chart.
We add boxes over the price action on sideways. See chart. We also observe the H M Gartley pattern, ABCD.
See chart, picture worth a thousand words.
Trade with eyes open.
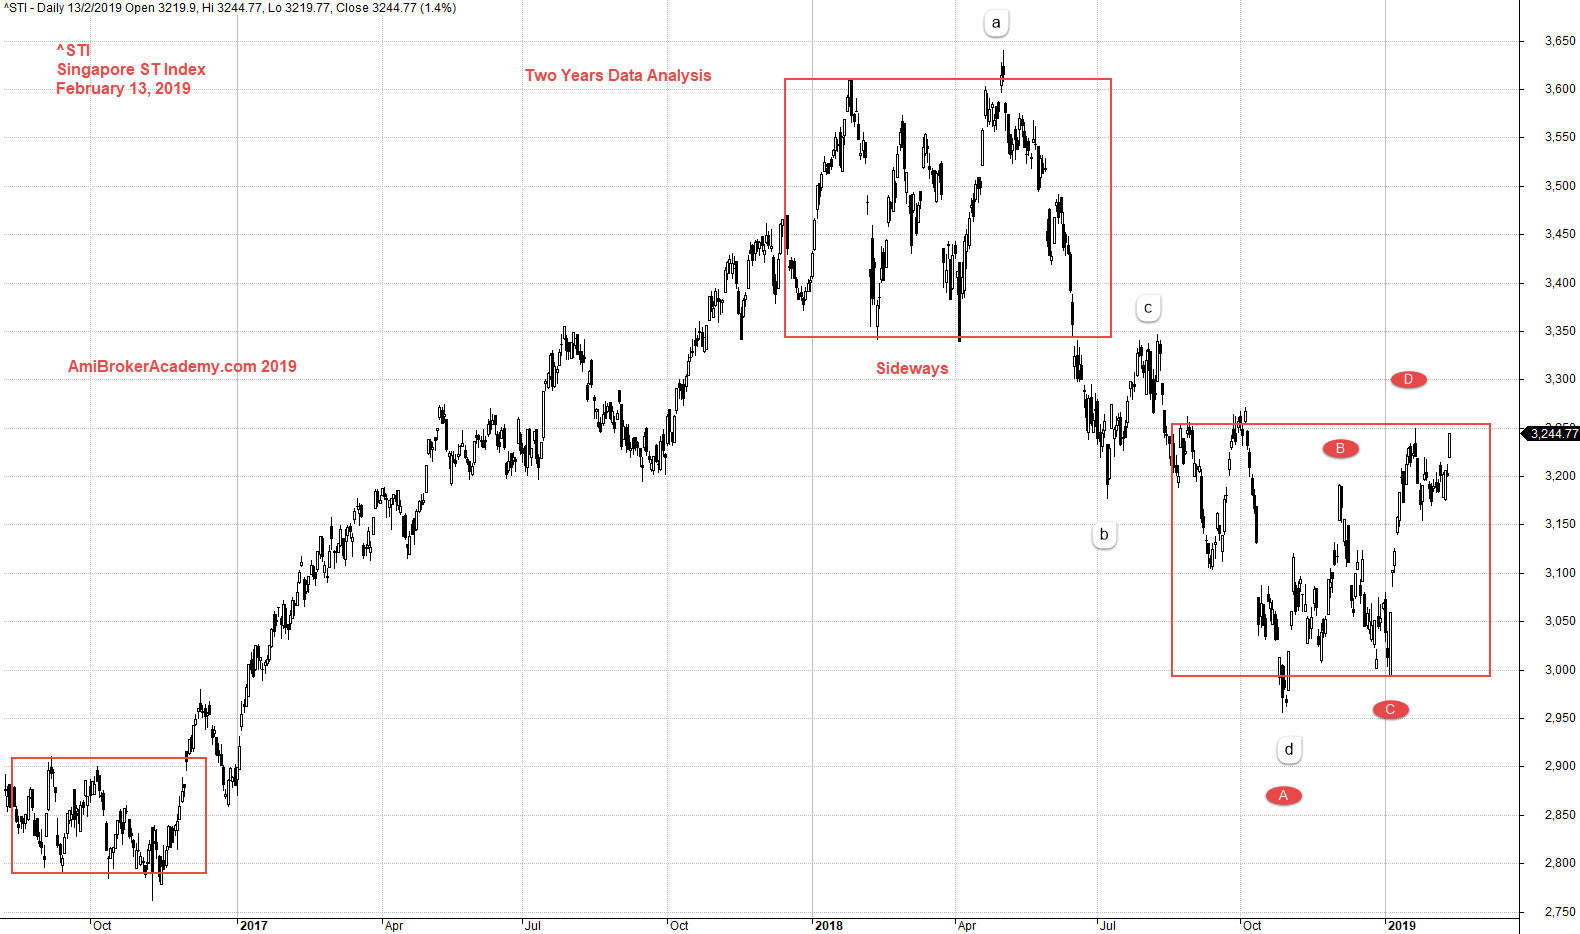
See chart, H M Gartley ABCD pattern.
Moses Stock Chart Analysis
AmiBrokerAcademy.com
Disclaimer
The above result is for illustration purpose. It is not meant to be used for buy or sell decision. We do not recommend any particular stocks. If particular stocks of such are mentioned, they are meant as demonstration of Amibroker as a powerful charting software and MACD. Amibroker can program to scan the stocks for buy and sell signals.
These are script generated signals. Not all scan results are shown here. The MACD signal should use with price action. Users must understand what MACD and price action are all about before using them. If necessary you should attend a course to learn more on Technical Analysis (TA) and Moving Average Convergence Divergence, MACD.
Once again, the website does not guarantee any results or investment return based on the information and instruction you have read here. It should be used as learning aids only and if you decide to trade real money, all trading decision should be your own.