February 21, 2018
February 16, 2018 is Chinese New Year. Those whom celebrate CNY will celebrate for 15 days. This is CNY tradition.
Today is the sixth day of CNY. Smooth sailing on the sixth day and for the entire year.

Sixth Day of CNY (Source, from What’s Apps Group)
US Stock Analysis
Dow Jones Industrial Average Index and Fibonacci Retracement Swing High to Low with 61.8% Retracement
See chart for more, after the rally from 78.6%, the pa stop at 61.8% from Swing High to Swing Low.
This week, we see the first bar, a bearish candlestick. Check H M Gartley pattern, check MACD for more clues.
Manage your risk.
Powerful Chart Software – AmiBroker
The following chart is produced using AmiBroker charting software. It is a powerful chart software. You plot the stocks you are interested all in one chart, as long as you still could read them. See chart below.
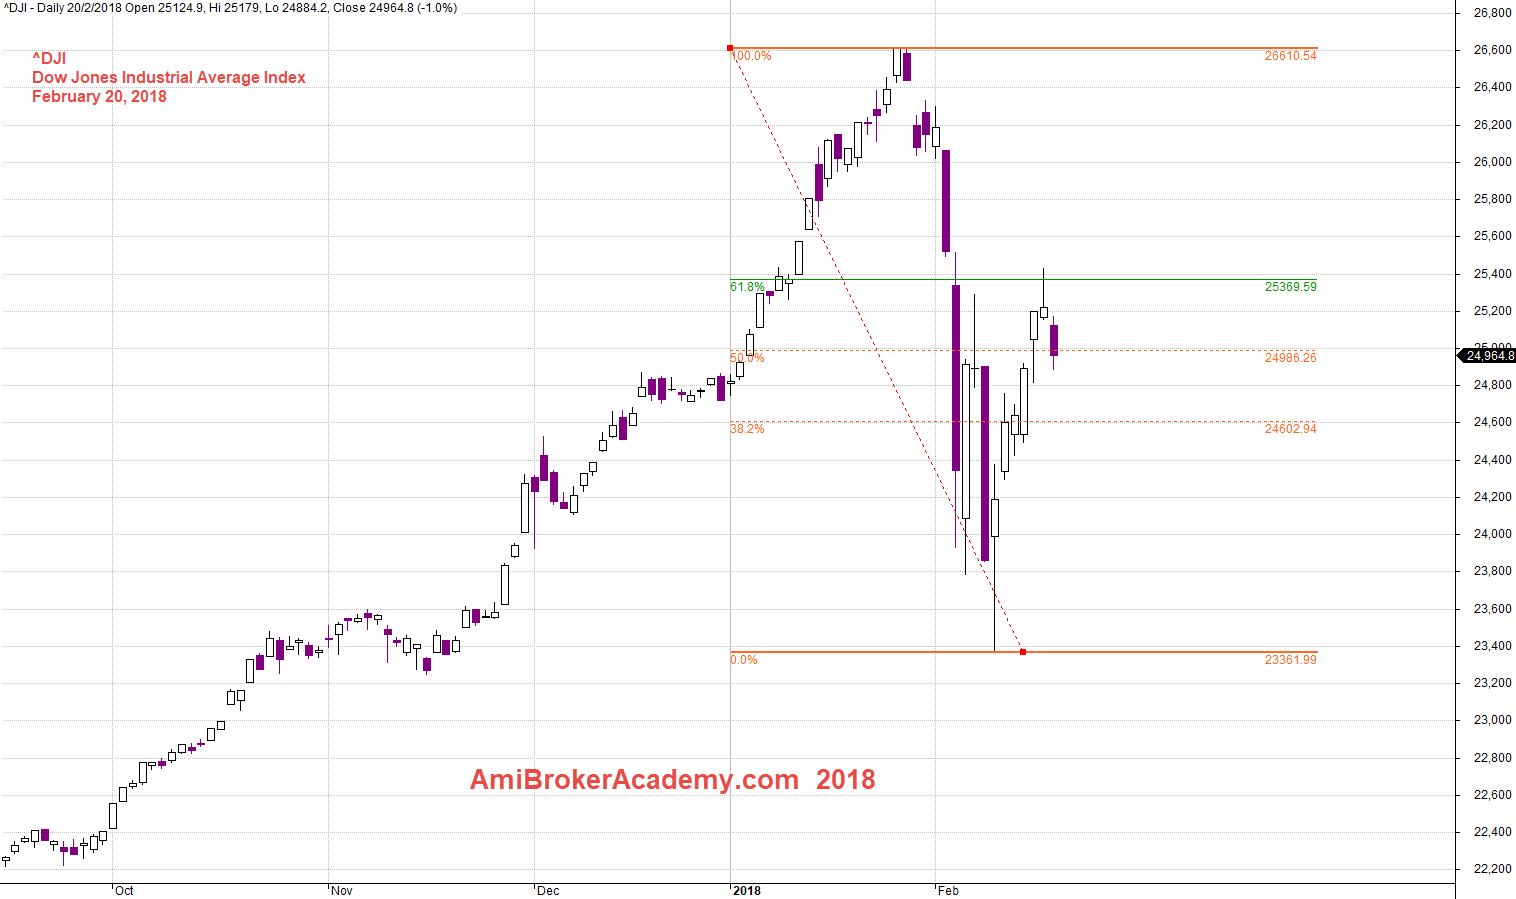
February 20, 2018 Dow Jones Industrial Average Index and Fibonacci Retracement Swing High to Low
^DJI Dow Jones Industrial Average Index and H M Gartley ABCD Bearish Pattern
See chart for more, H M Gartley ABCD Bearish pattern. In this case, it will be a further correction. Manage your risk.
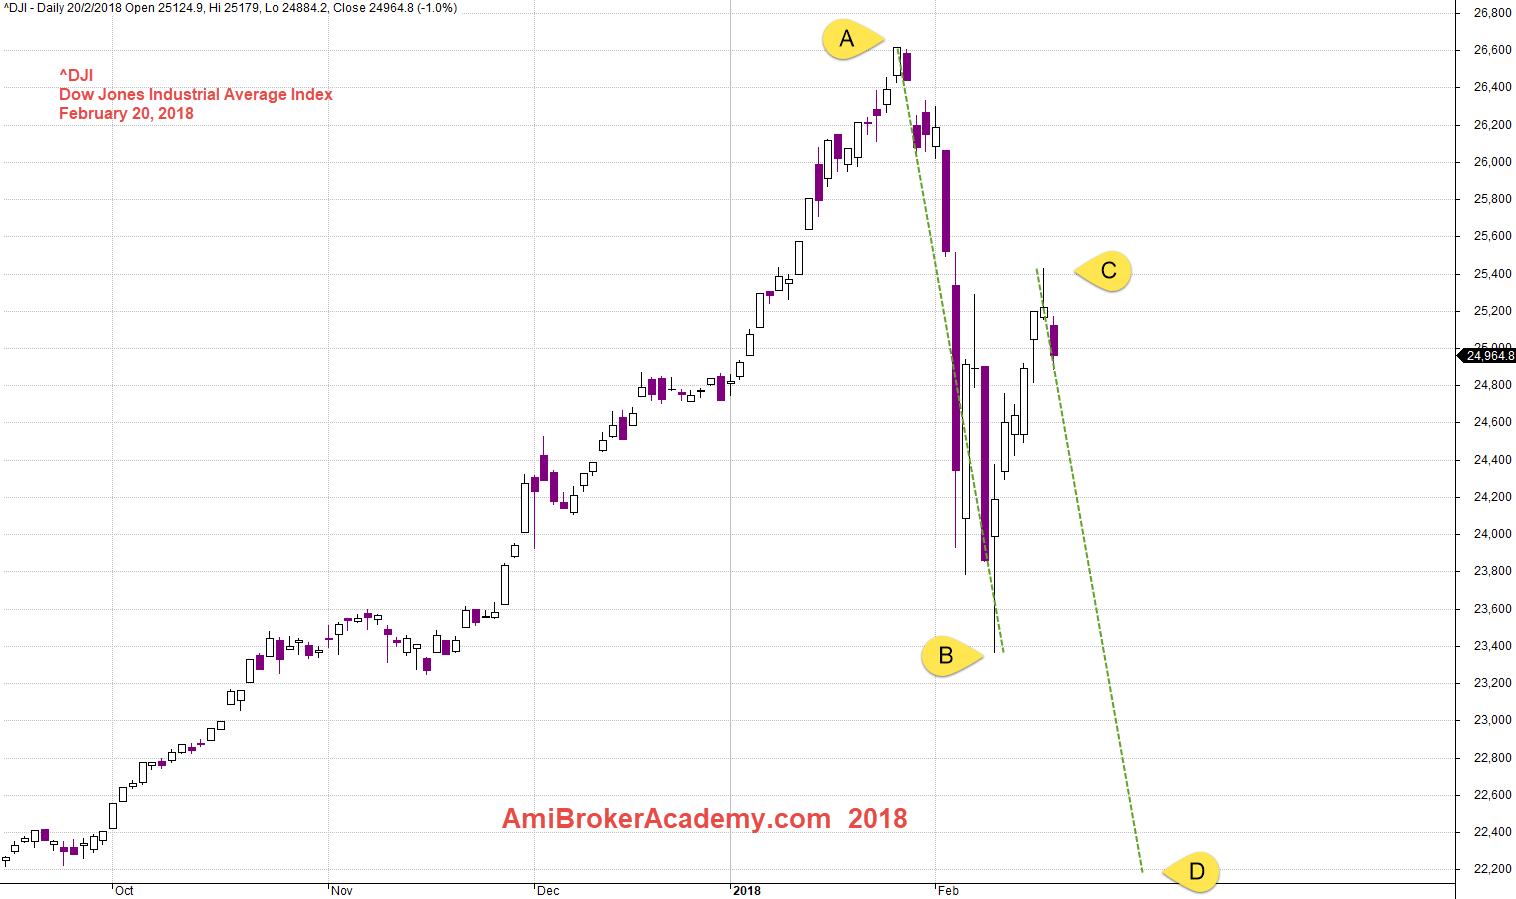
February 20, 2018 Dow Jones Industrial Average Index and HM Gartley ABCD
^DJI Dow Jones Industrial Average Index and MACD
See chart for more, price forms higher high, but MACD-H forms lower high. Change in trend direction. Will see.
Manage your risk.
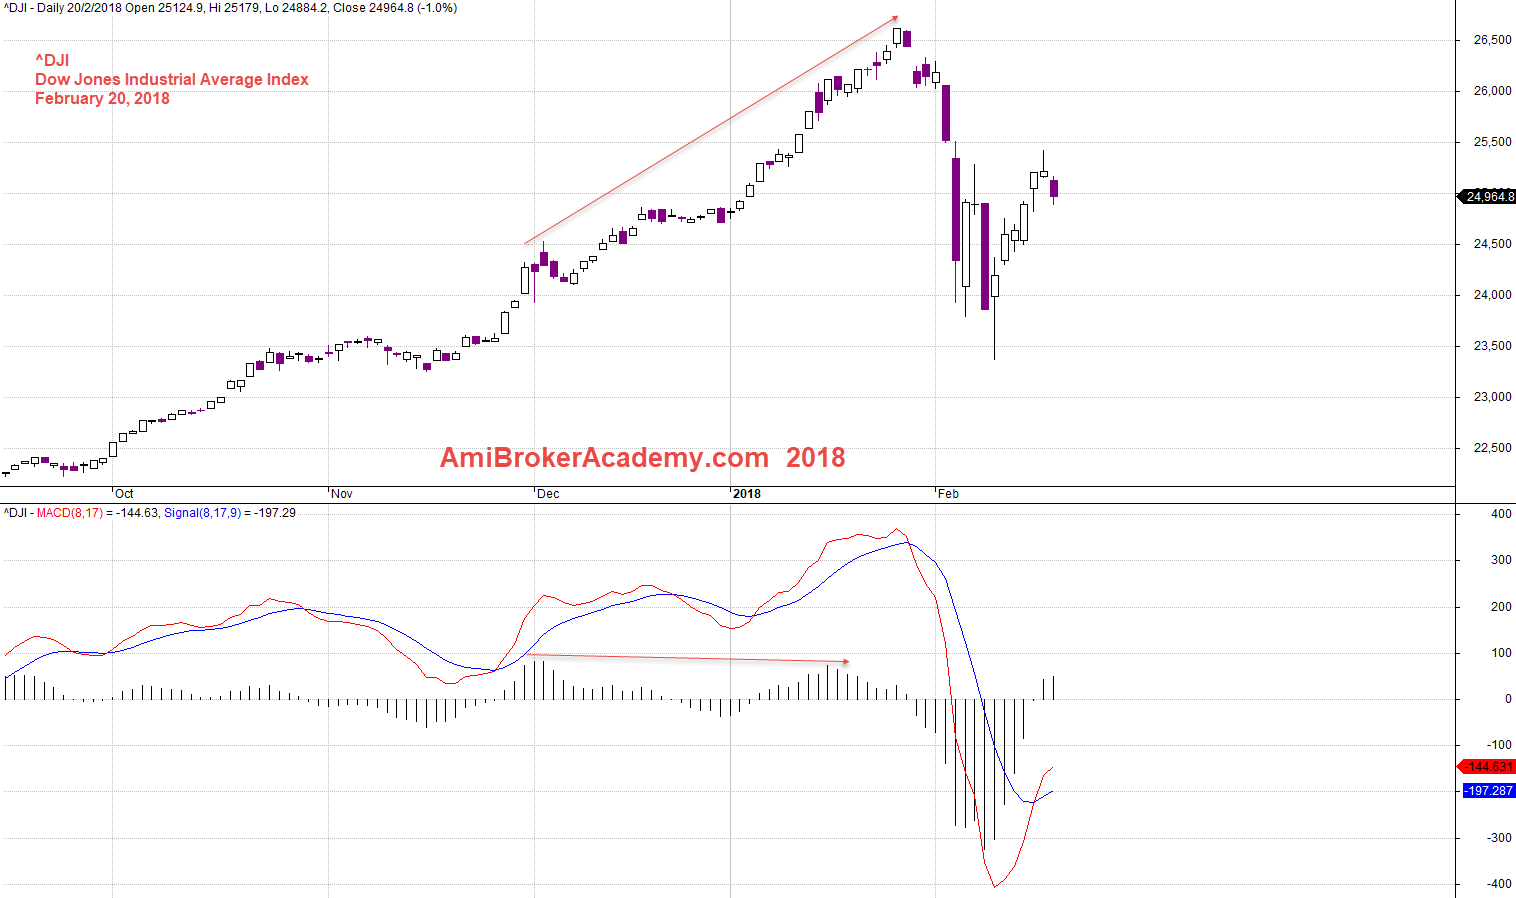
20180220 Dow Jones Industrial Average Index and MACD
Moses
AmiBrokerAcademy.com
Disclaimer
The above result is for illustration purpose. It is not meant to be used for buy or sell decision. We do not recommend any particular stocks. If particular stocks of such are mentioned, they are meant as demonstration of Amibroker as a powerful charting software and MACD. Amibroker can program to scan the stocks for buy and sell signals.
These are script generated signals. Not all scan results are shown here. The MACD signal should use with price action. Users must understand what MACD and price action are all about before using them. If necessary you should attend a course to learn more on Technical Analysis (TA) and Moving Average Convergence Divergence, MACD.
Once again, the website does not guarantee any results or investment return based on the information and instruction you have read here. It should be used as learning aids only and if you decide to trade real money, all trading decision should be your own.