February 21, 2018
The hottest trader-able finance instrument in the current market, Bitcoin and bitcoin price is so high.
What is Bitcoin?
From google result, “a type of digital currency in which encryption techniques are used to regulate the generation of units of currency and verify the transfer of funds, operating independently of a central bank.”
Sound interesting righ, “operating independently of a central bank”.
Bitcoin Analysis
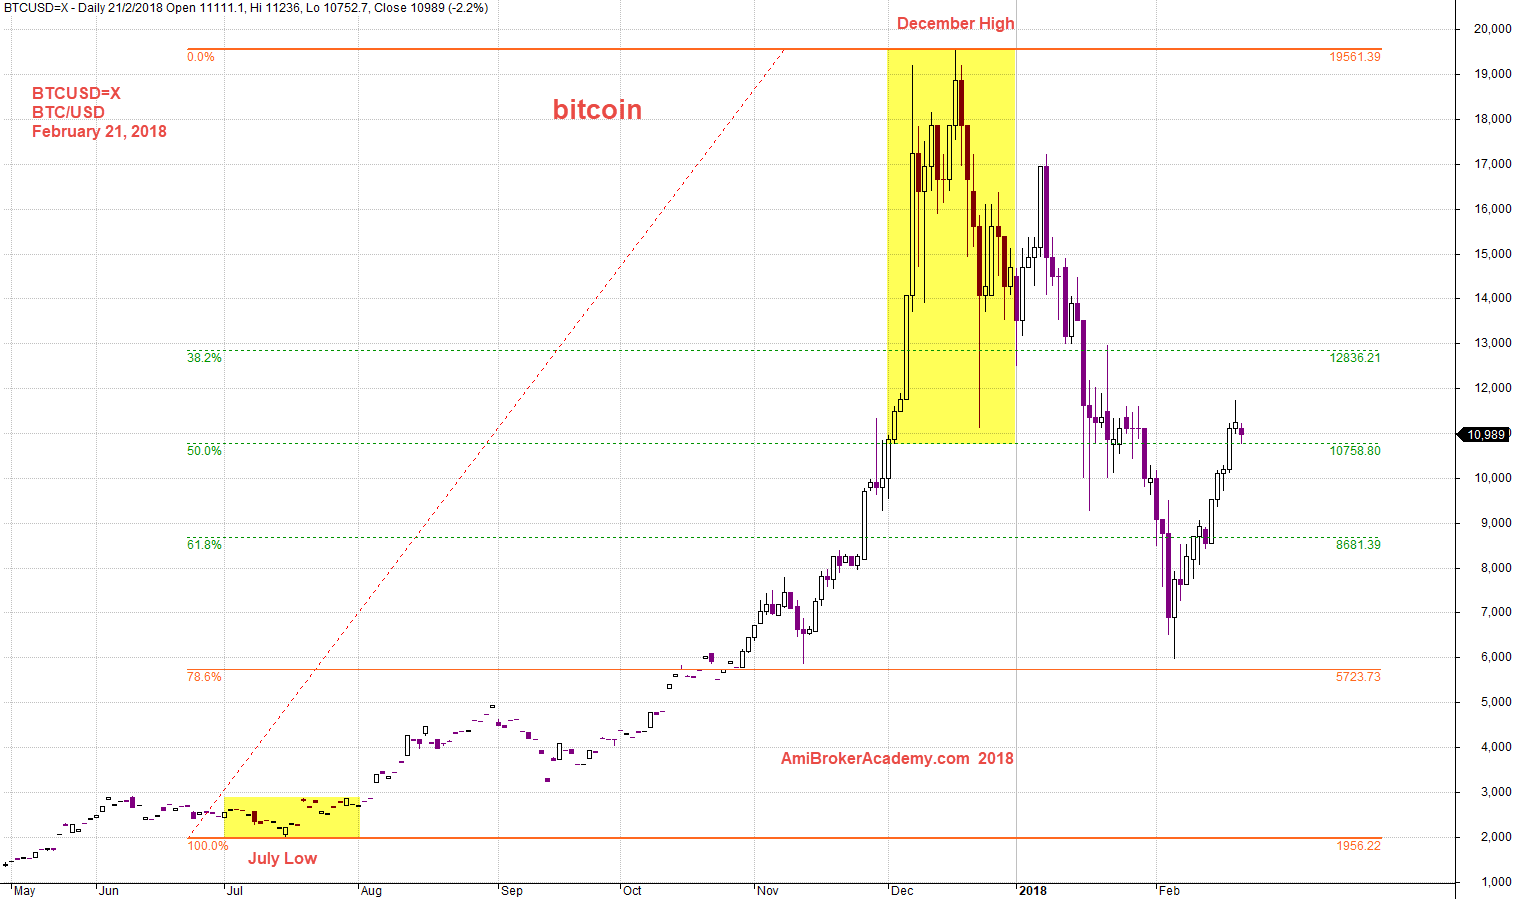
Bitcon BTCUSD and Fibonacci Retracement From Low to High
See chart for more, swing Low from July 2017 Low to December 2017 High, the price action retrace down near 78.6% and rebounced. What will happen this week? Will see.
Manage your risk!
Powerful Chart Software – AmiBroker
The following chart is produced using AmiBroker charting software. It is a powerful chart software. Anything, finance ticket you could download from Yahoo! Finance you could plot them, those you are interested all in a chart, so you could analyse them. See chart below like the popular Bitcoin.
February 21, 2018 bitcoin and Fibonacci Retracement Swing Low to High
Bitcon BTCUSD and Fibonacci Retracement From High to Low
See chart for more.
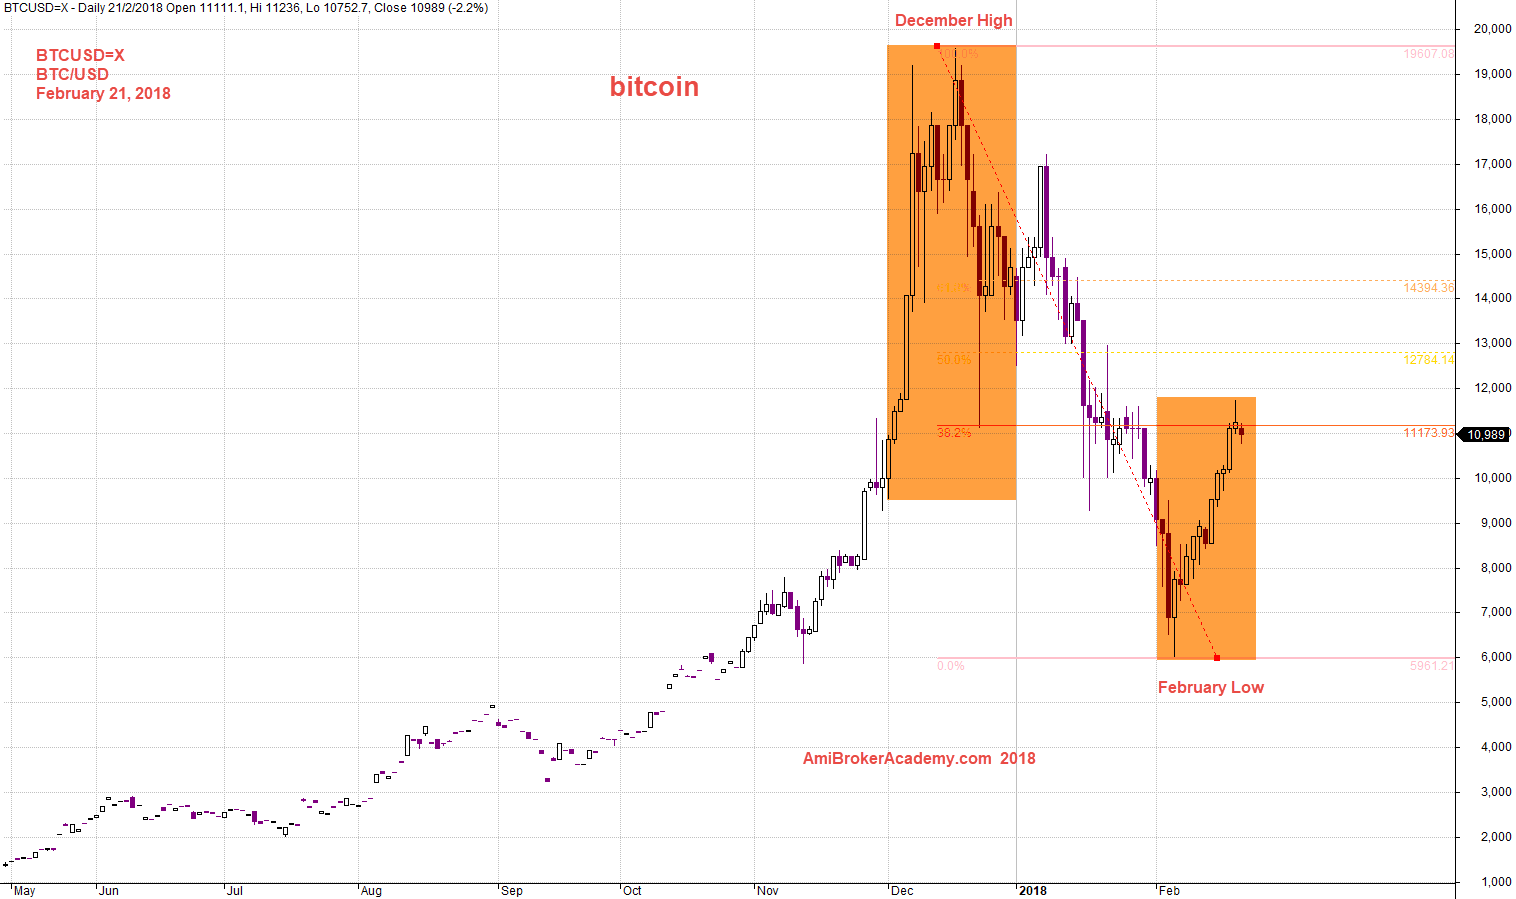
February 21, 2018 bitcoin and Fibonacci Retracement Swing High to Low
Bitcon BTCUSD Was Ten Times (10X) the Price of Early 2017
See chart for more.
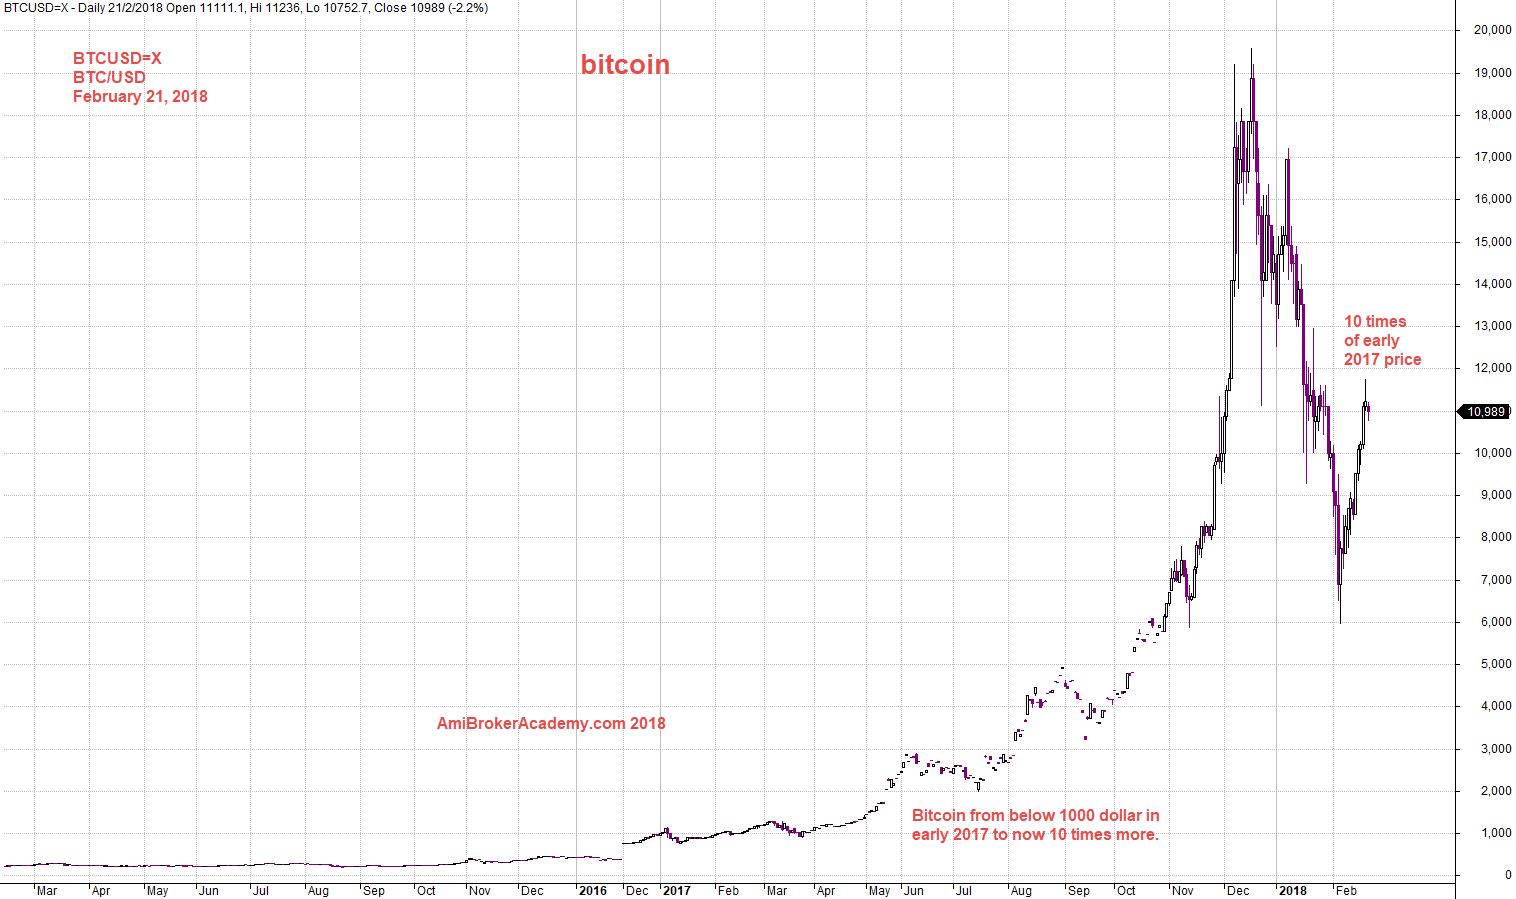
20180221 bitcoin 10 times 2017 January price
Worst Bitcon BTCUSD Projection
A bearish ABCD on a CD leg, see chart for more. Manage your risk
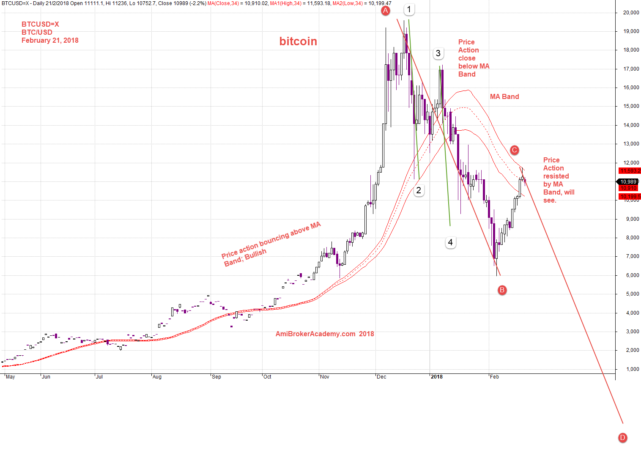
February 21, 2018 bitcoin and MA Band
Moses
AmiBrokerAcademy.com
Disclaimer
The above result is for illustration purpose. It is not meant to be used for buy or sell decision. We do not recommend any particular stocks. If particular stocks of such are mentioned, they are meant as demonstration of Amibroker as a powerful charting software and MACD. Amibroker can program to scan the stocks for buy and sell signals.
These are script generated signals. Not all scan results are shown here. The MACD signal should use with price action. Users must understand what MACD and price action are all about before using them. If necessary you should attend a course to learn more on Technical Analysis (TA) and Moving Average Convergence Divergence, MACD.
Once again, the website does not guarantee any results or investment return based on the information and instruction you have read here. It should be used as learning aids only and if you decide to trade real money, all trading decision should be your own.