January 25, 2018
US Pharmaceutical Stock Analysis
GSK GlaxoSmithKline and Year High Low From 2009
GSK stock tested the high of 57 in 2014, then the stock decline to now the low of just above 34. GSK stock price fallen, just keep forming lower high and lower low. Now GSK just rebounce just below 39, so if you have bought the stock at the high, real high say 56, and hold the stock till today, you will lost (56-39) 17 dollars for every share. Not easy, not easy, trading has never be easy. Those who make money from trading stock, has really buy at the right time and sell at the right time. In other words, buy at low and sell at high.
Picture worth a thousand words, see chart and think, think think (think more) and got more things. Have fun!
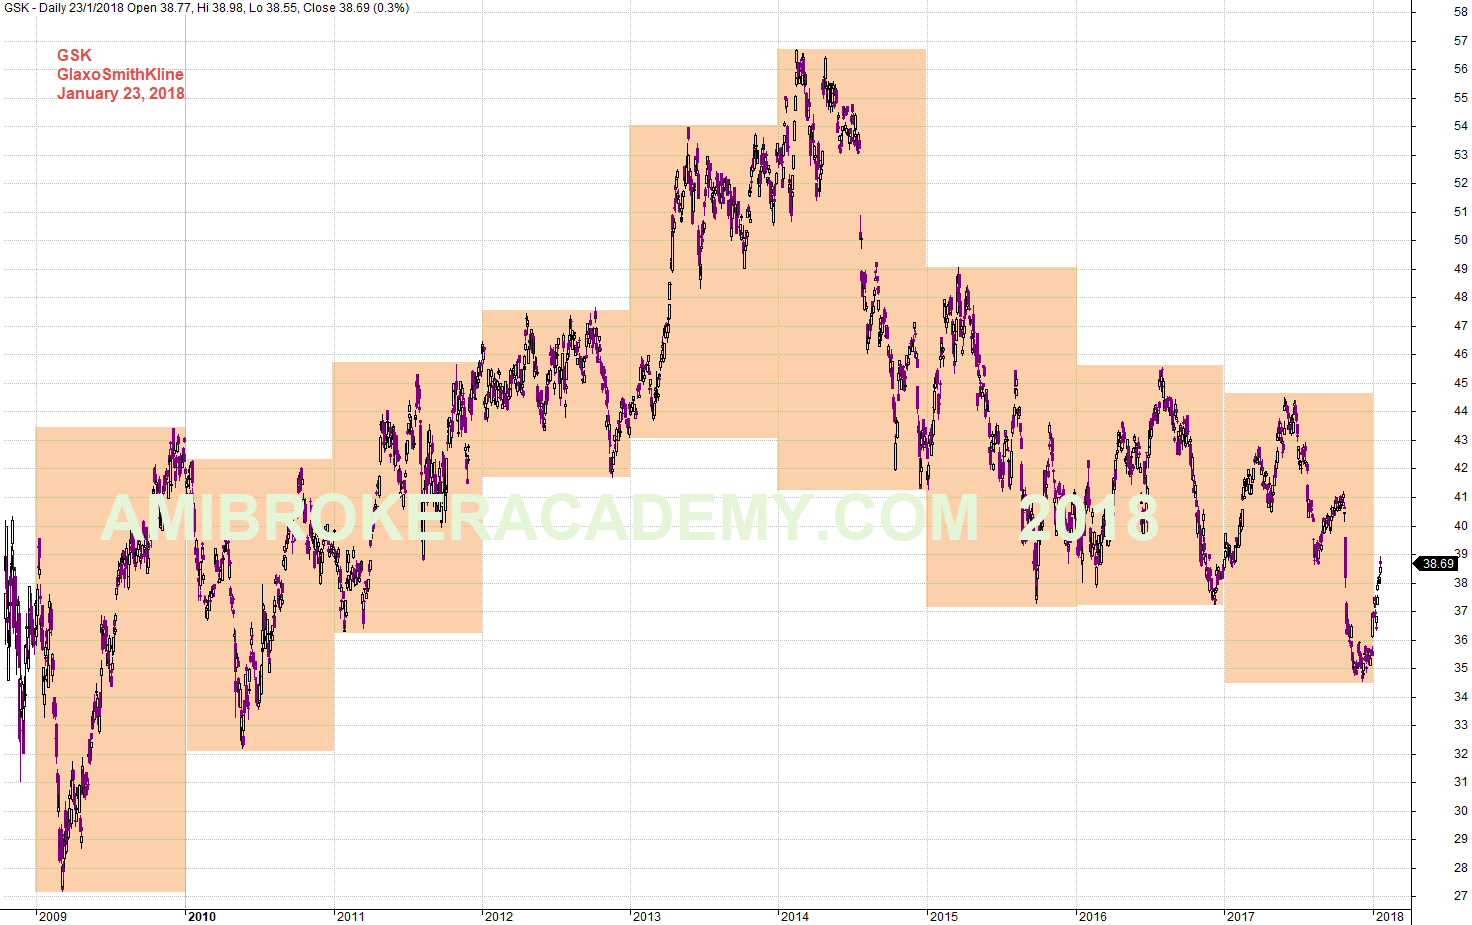
January 23, 2018 GlaxoSmithKline and Year High Low
Manage your risk.
Powerful Chart Software – AmiBroker
The following chart is produced using AmiBroker charting software. It is a powerful chart software. You plot the stocks you are interested all in one chart, as long as you still could read them. See chart below.
ABT Abbott Laboratories and GSK GlaxoSmithKline Correlation
Picture worth a thousand words, benchmark both pharmaceutical stocks and what you get.
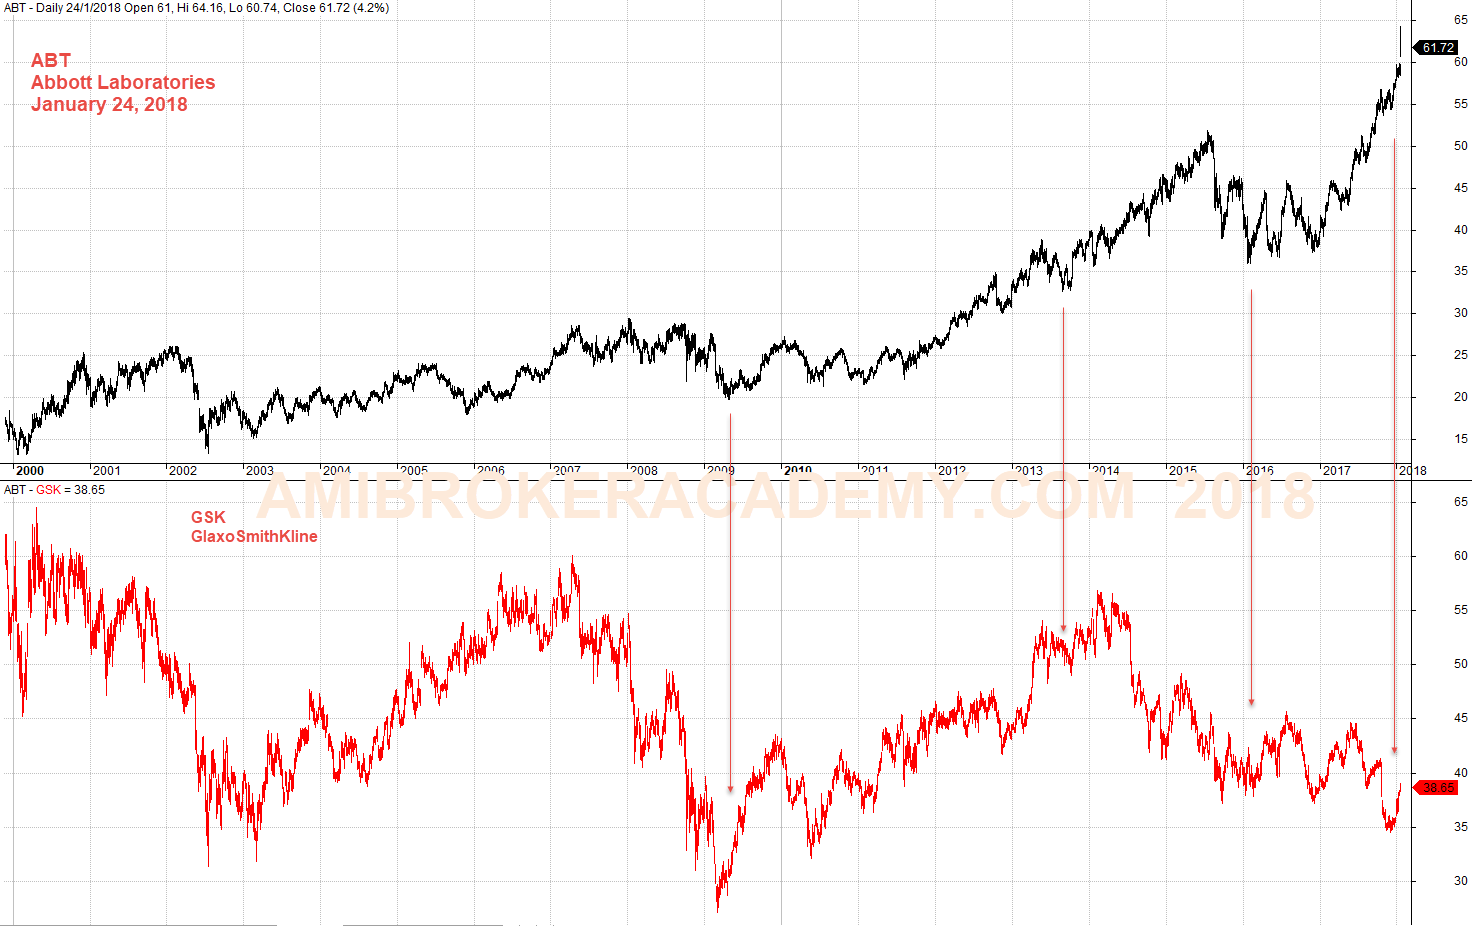
January 24, 2018 Abbott Laboratories and GlaxoSmithKline Correlation
Moses
AmiBrokerAcademy.com
Disclaimer
The above result is for illustration purpose. It is not meant to be used for buy or sell decision. We do not recommend any particular stocks. If particular stocks of such are mentioned, they are meant as demonstration of Amibroker as a powerful charting software and MACD. Amibroker can program to scan the stocks for buy and sell signals.
These are script generated signals. Not all scan results are shown here. The MACD signal should use with price action. Users must understand what MACD and price action are all about before using them. If necessary you should attend a course to learn more on Technical Analysis (TA) and Moving Average Convergence Divergence, MACD.
Once again, the website does not guarantee any results or investment return based on the information and instruction you have read here. It should be used as learning aids only and if you decide to trade real money, all trading decision should be your own.