January 25, 2018
US Stock Analysis
BLK BlackRock Inc Year High Low From 2000
Picture worth a thousand words, see chart. the last great high, 240 was at 2008 before the Great Recession. Since 2009 BLK start bullish again, now we see a high in 2017, break 520. Just a few days into 2018, the price approaching 600.
Picture worth a thousand words, see chart and think, think think (think more) and got more things. Have fun!
Manage your risk.
Powerful Chart Software – AmiBroker
The following chart is produced using AmiBroker charting software. It is a powerful chart software. You plot the stocks you are interested all in one chart, as long as you still could read them. See chart below.
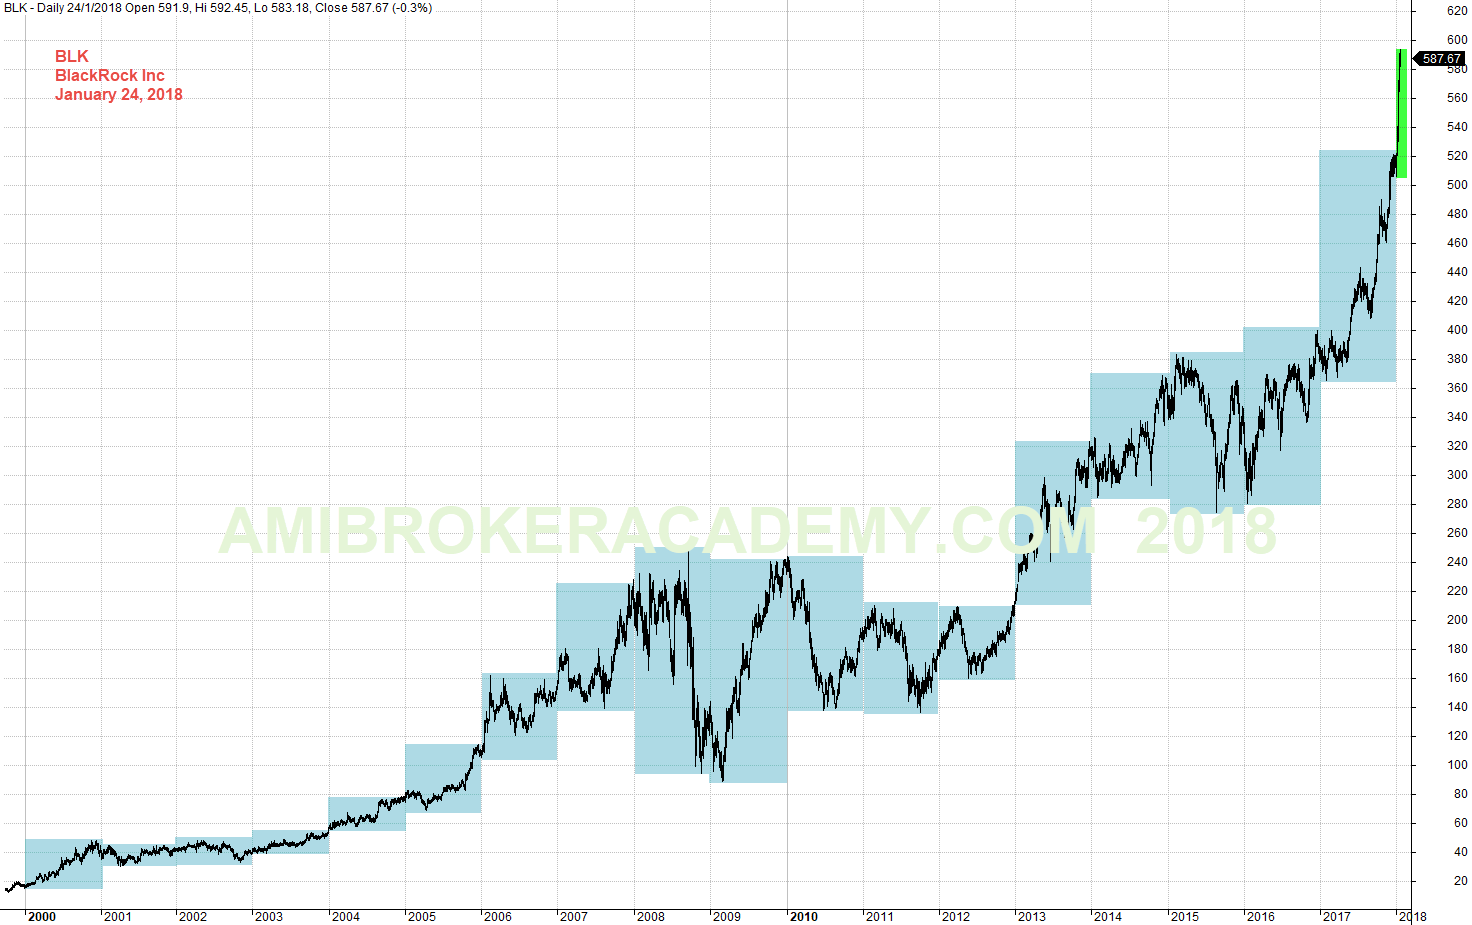
January 24, 2018 BlackRock Inc Year High Low from 2000
BLK BlackRock Inc Year High Low From 2008
Zoom in to study the chart again, see the year high low.
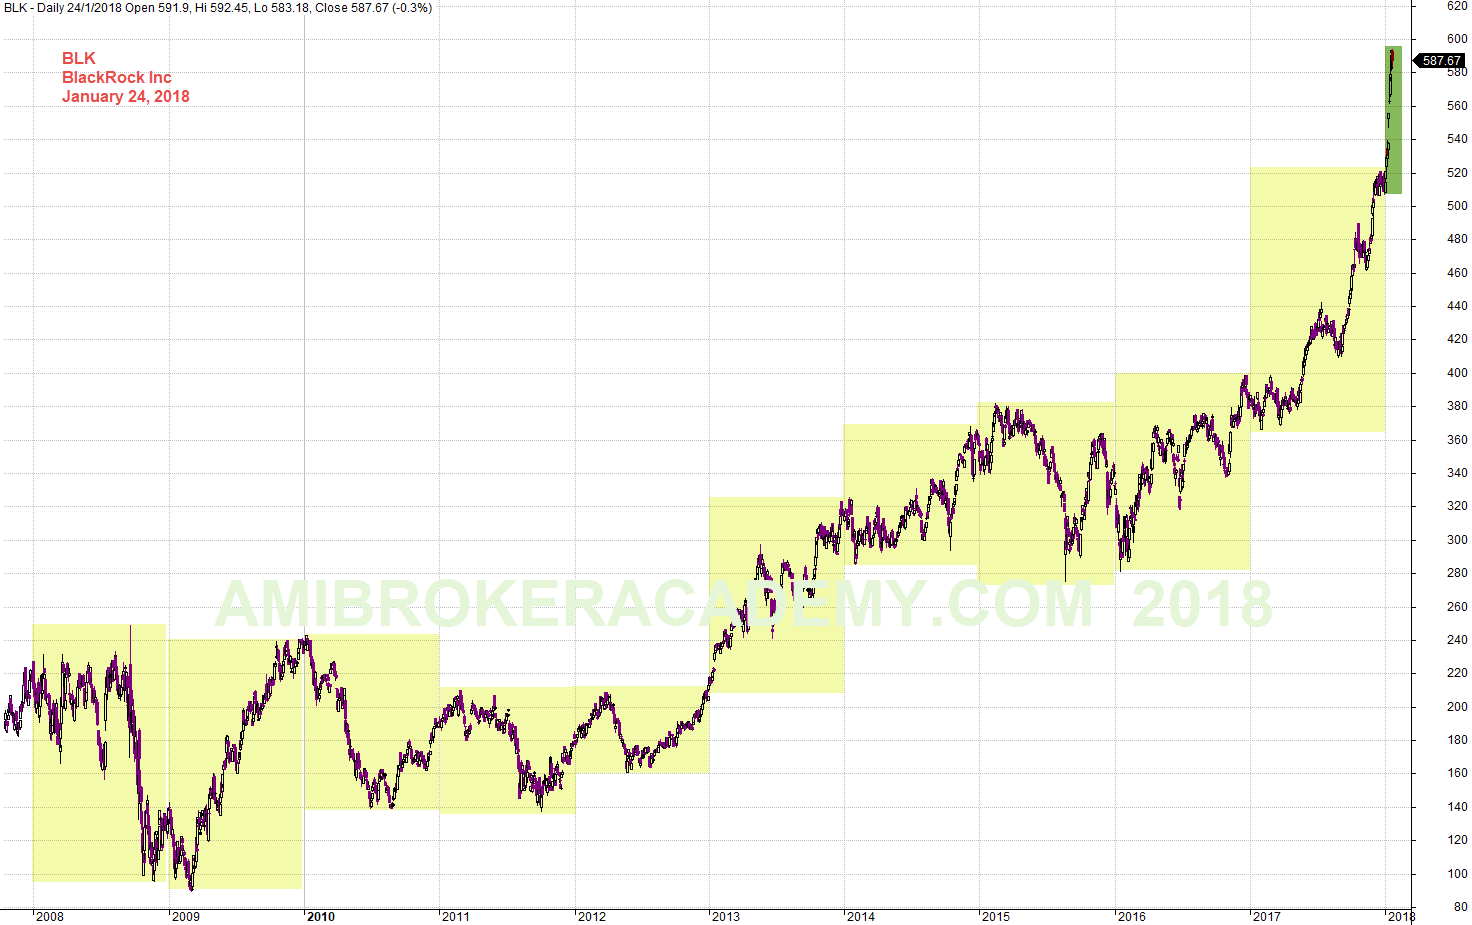
January 24, 2018 BlackRock Inc Year High Low From 2008
BLK BlackRock Inc Year High Low From 2008
Zoom in further, and study the chart again, see the stock quarter and year high low. It is very obvious that each quarter is stepping upward. Except the last quarter of 2016 and the first quarter of 2017, the high the same, that means the resistance was very strong. Thereafter, the price just speed up,
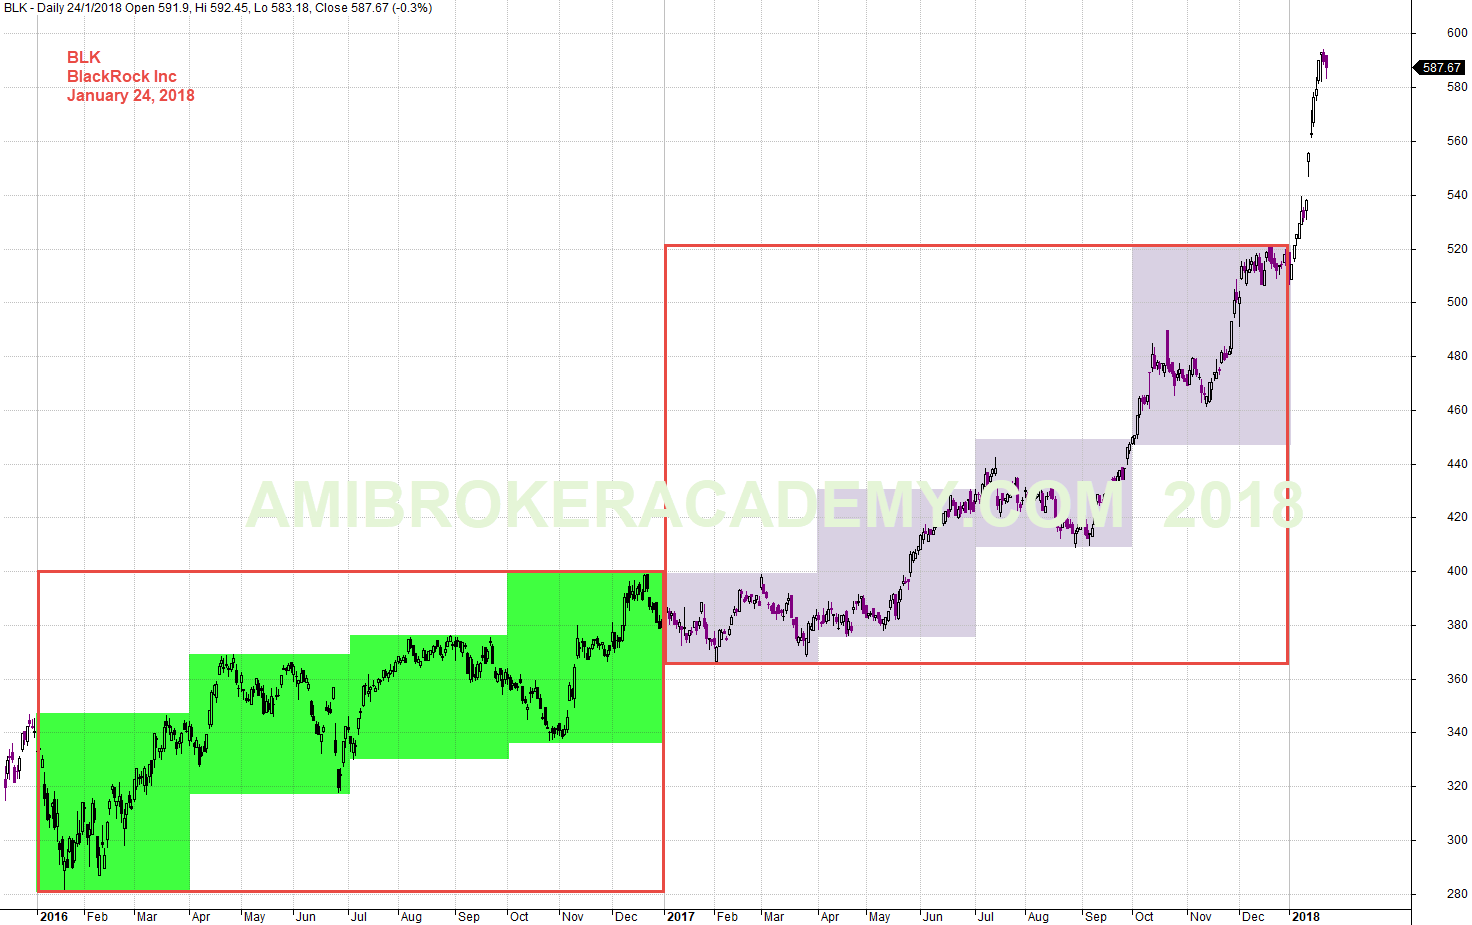
January 24, 2018 BlackRock Inc Quarter and Year High Low
BLK BlackRock Inc and MACD
Picture worth a thousand words, see chart for more.
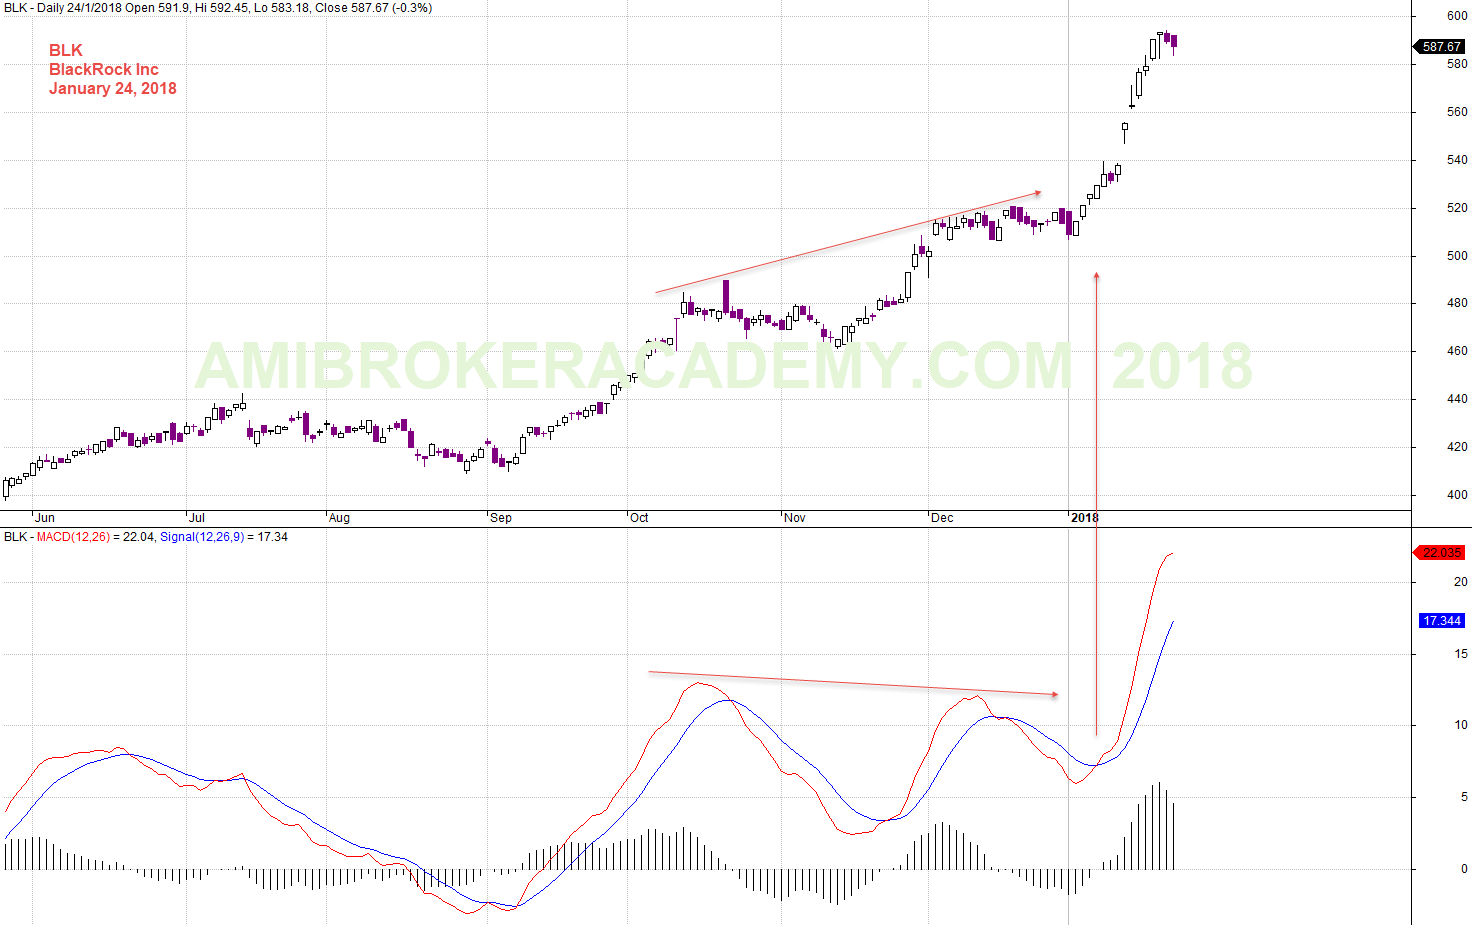
January 24, 2018 BlackRock Inc and MACD
Moses
AmiBrokerAcademy.com
Disclaimer
The above result is for illustration purpose. It is not meant to be used for buy or sell decision. We do not recommend any particular stocks. If particular stocks of such are mentioned, they are meant as demonstration of Amibroker as a powerful charting software and MACD. Amibroker can program to scan the stocks for buy and sell signals.
These are script generated signals. Not all scan results are shown here. The MACD signal should use with price action. Users must understand what MACD and price action are all about before using them. If necessary you should attend a course to learn more on Technical Analysis (TA) and Moving Average Convergence Divergence, MACD.
Once again, the website does not guarantee any results or investment return based on the information and instruction you have read here. It should be used as learning aids only and if you decide to trade real money, all trading decision should be your own.