May 22, 2019
Welcome!
Welcome to AmiBrokerAcademy.com. Thanks for visiting the site.
Have fun!
AAWW Atlas Air Worldwide Holdings Stock Charting
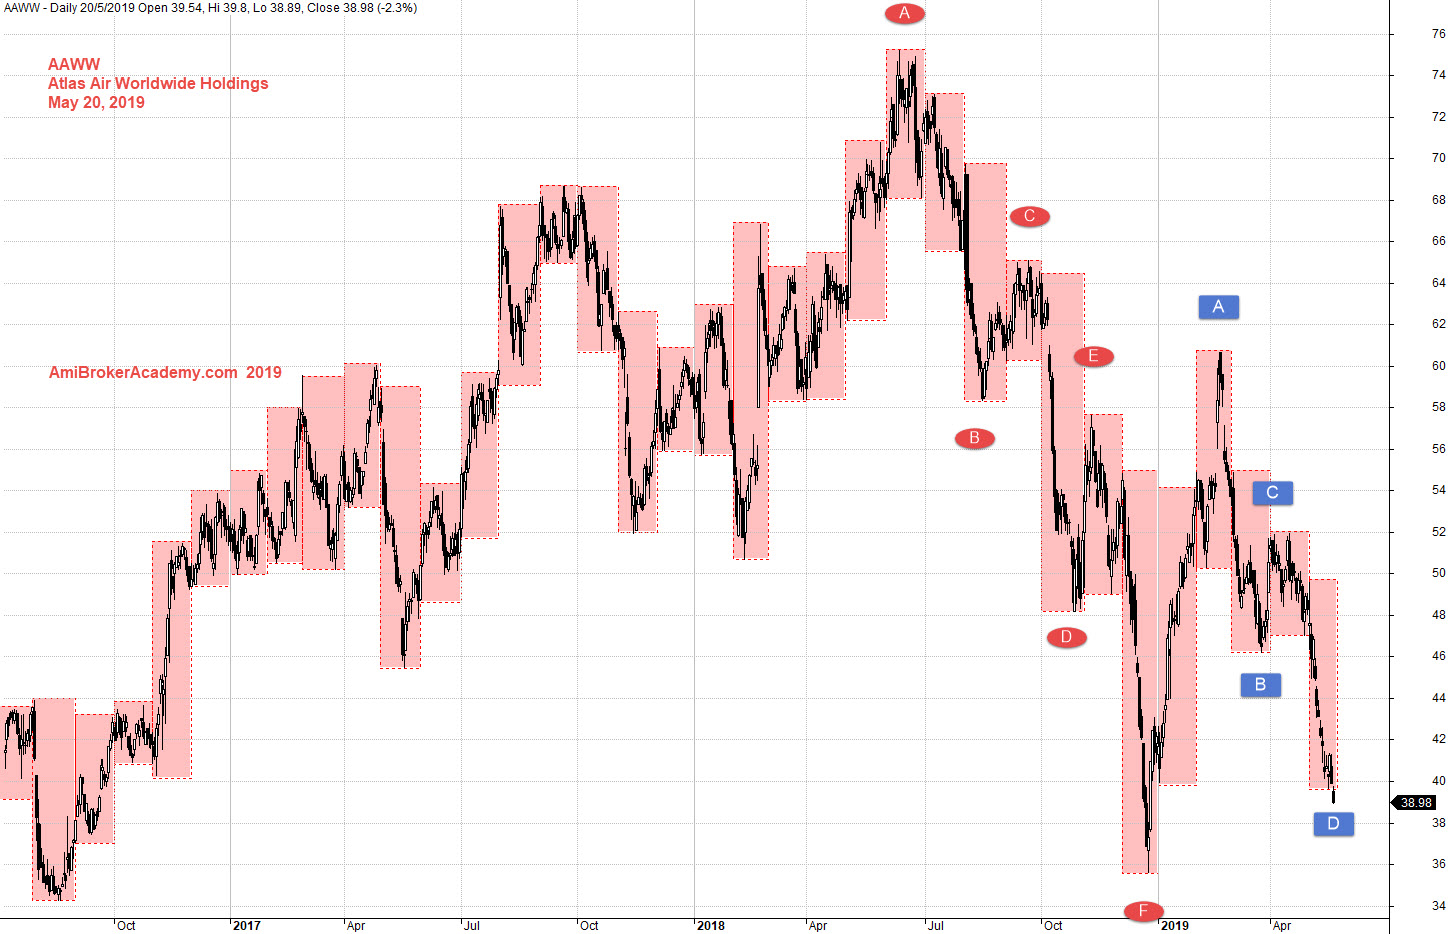
Study Atlas Air Worldwide Holdings stock chart and month high low.
See chart, picture worth a thousand words.
Price Action was on an up trend. After tested the high above 74 dollars, price action begin to drift south. Price Action follows Gartley pattern, such as three drive bear to test the low below 36 dollars.
Price Action seems to recover to reverse but fail. The price action continues another Gartley pattern down again.
Trade with your eyes open.
Moses Stock Observation
AmiBrokerAcademy.com
Disclaimer
The above result is for illustration purpose. It is not meant to be used for buy or sell decision. We do not recommend any particular stocks. If particular stocks of such are mentioned, they are meant as demonstration of Amibroker as a powerful charting software and MACD. Amibroker can program to scan the stocks for buy and sell signals.
These are script generated signals. Not all scan results are shown here. The MACD signal should use with price action. Users must understand what MACD and price action are all about before using them. If necessary you should attend a course to learn more on Technical Analysis (TA) and Moving Average Convergence Divergence, MACD.
Once again, the website does not guarantee any results or investment return based on the information and instruction you have read here. It should be used as learning aids only and if you decide to trade real money, all trading decision should be your own.