May 22, 2019
Welcome!
Welcome to AmiBrokerAcademy.com. Thanks for visiting the site.
Have fun!
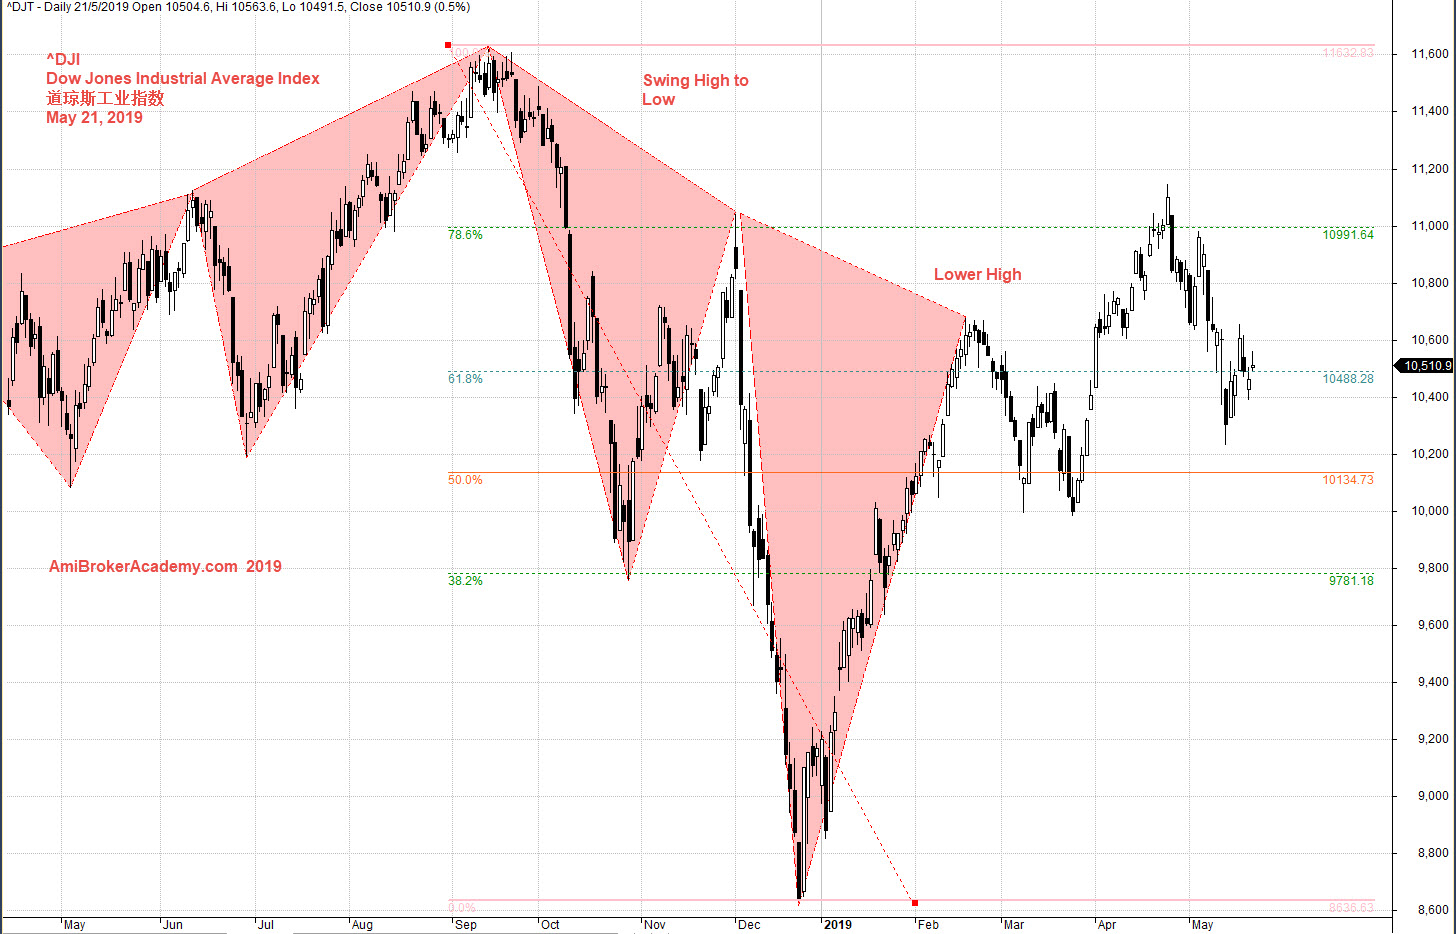
^DJI Dow Jones Industrial Average Index 道琼斯工业指数 Stock Charting
Study Dow Jones Industrial Average Index 道琼斯工业指数 stock chart and Fibonacci.
See chart, picture worth a thousand words.
Swing high to low tofind the possible resistance. This picture was true from the start of the year. But this picture begin to change from April. See our next posting your will know why.
Price Action after the pullback to test 76% level, the price action begin to change direction.
Trade with your eyes open.
Other the retail trader like you and I, there are two group of traders that influence the market very very strongly. One is the private investor, and another is the venture capitalists (VC). These two group of traders pursuit details about their investment. They could spend weeks meeting with company executives, and consultants whom can provide expert opinions on the target investment business. Many will leave no stone unturned. By the time they decide to investment, they know absolutely everything that can be known about the target investment.
Basically, both private investor and venture capitalists are try very hard to reduce their risk as much as they can. So, can they fail? Sure, they are like any other traders or retail traders. Except they structure themself to move in and out, they can be more afford a significant loss than retail traders.
Moses Stock Observation
AmiBrokerAcademy.com
Disclaimer
The above result is for illustration purpose. It is not meant to be used for buy or sell decision. We do not recommend any particular stocks. If particular stocks of such are mentioned, they are meant as demonstration of Amibroker as a powerful charting software and MACD. Amibroker can program to scan the stocks for buy and sell signals.
These are script generated signals. Not all scan results are shown here. The MACD signal should use with price action. Users must understand what MACD and price action are all about before using them. If necessary you should attend a course to learn more on Technical Analysis (TA) and Moving Average Convergence Divergence, MACD.
Once again, the website does not guarantee any results or investment return based on the information and instruction you have read here. It should be used as learning aids only and if you decide to trade real money, all trading decision should be your own.