23 May, 2018
Thank you for visiting the site. Hope you like the content.
BTCUSD Bitcoin Charting
See chart, picture worth a thousand words.
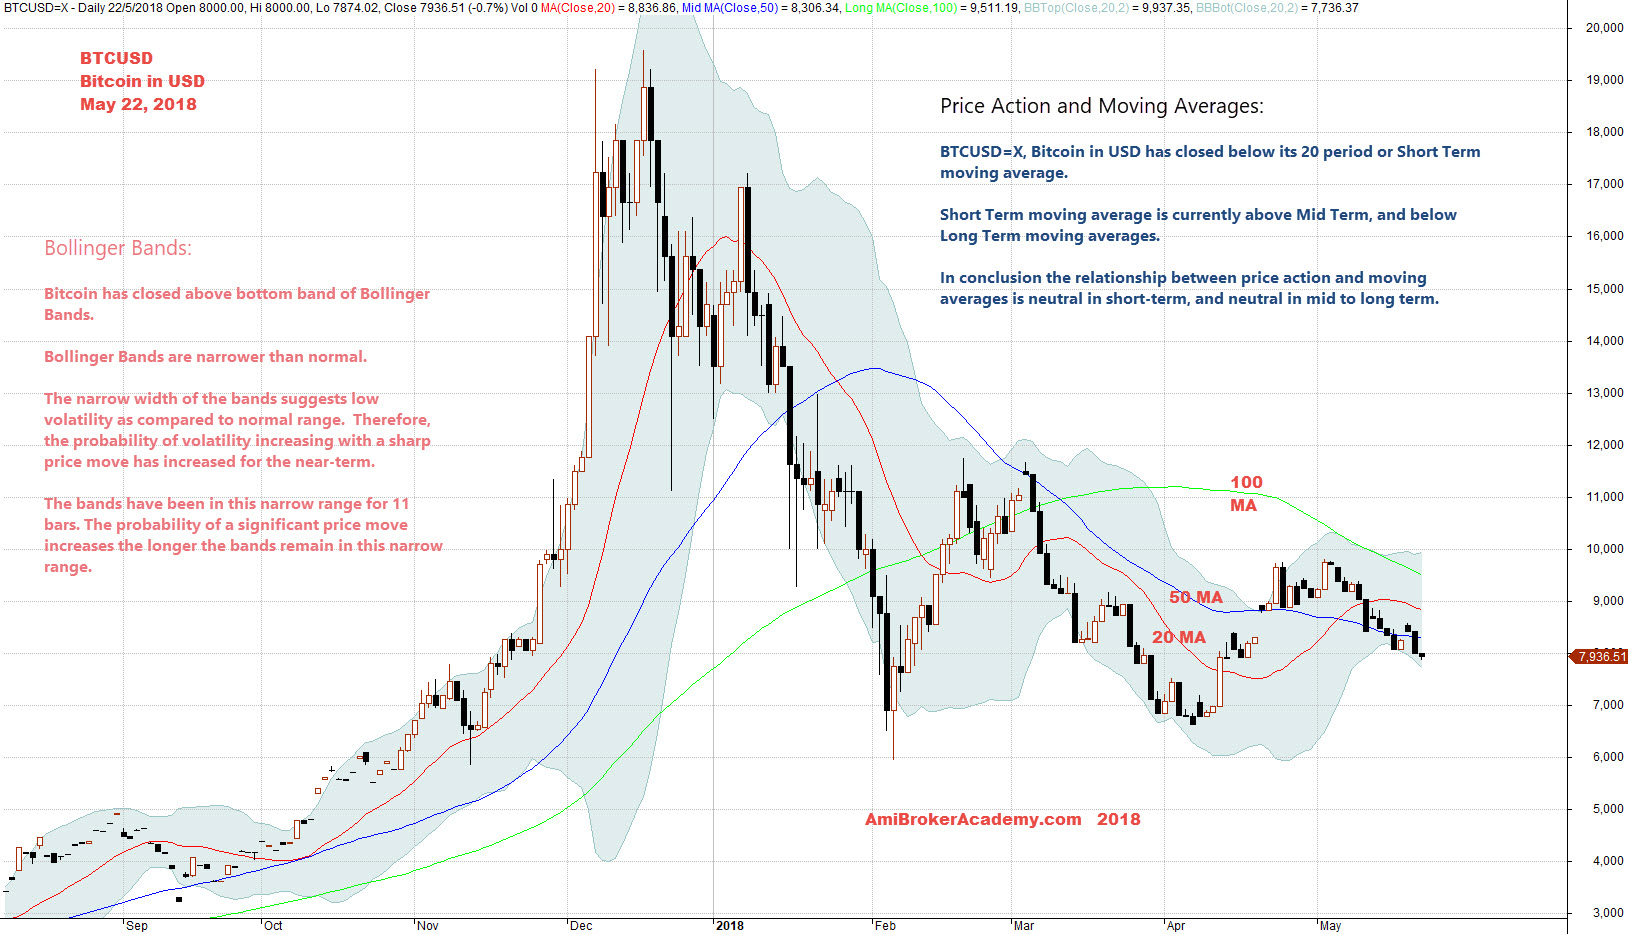
Price Action and Moving Averages:
BTCUSD=X, Bitcoin in USD has closed below its 20 period or Short Term moving average.
Short Term moving average is currently above Mid Term, and below Long Term moving averages.
In conclusion the relationship between price action and moving averages is neutral in short-term, and neutral in mid to long term.
Bollinger Bands:
Bitcoin has closed above bottom band of Bollinger Bands.
Bollinger Bands are narrower than normal.
The narrow width of the bands suggests low volatility as compared to normal range. Therefore, the probability of volatility increasing with a sharp price move has increased for the near-term.
The bands have been in this narrow range for 11 bars. The probability of a significant price move increases the longer the bands remain in this narrow range.
Manager your trade risk.
May 22, 2018 Bitcoin and Moving Average and Bollinger Bands
Free MACD Scan One-day US Stock MACD Screening Results on May 22 2018
Remember all setup can fail. This is true for all indicators. It is also true for MACD signals setup. See some of the MACD setup fail examples on this website.
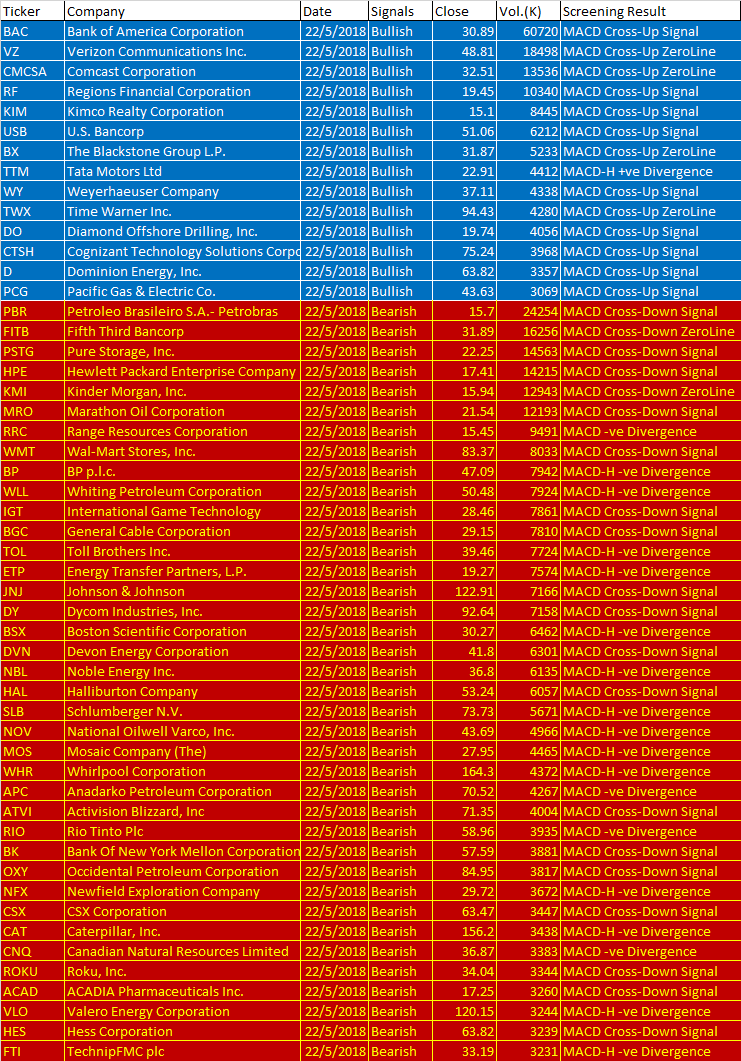
May 22, 2018 US Stock One-day MACD Signals
These are the six types of MACD Signals:
- MACD line crosses above MACD signal – Bullish trend
- MACD line crosses above zero line – Bullish trend
- MACD Histogram +ve Divergence – Bullish trend
- MACD line crosses below MACD signal – Bearish trend
- MACD line crosses below zero line – Bearish trend
- MACD Histogram -ve Divergence – Bearish trend
| Ticker | Company | Date | Signals | Close | Vol.(K) | Screening Result |
| BAC | Bank of America Corporation | 22/5/2018 | Bullish | 30.89 | 60720 | MACD Cross-Up Signal |
| VZ | Verizon Communications Inc. | 22/5/2018 | Bullish | 48.81 | 18498 | MACD Cross-Up ZeroLine |
| CMCSA | Comcast Corporation | 22/5/2018 | Bullish | 32.51 | 13536 | MACD Cross-Up ZeroLine |
| RF | Regions Financial Corporation | 22/5/2018 | Bullish | 19.45 | 10340 | MACD Cross-Up Signal |
| KIM | Kimco Realty Corporation | 22/5/2018 | Bullish | 15.1 | 8445 | MACD Cross-Up Signal |
| USB | U.S. Bancorp | 22/5/2018 | Bullish | 51.06 | 6212 | MACD Cross-Up Signal |
| BX | The Blackstone Group L.P. | 22/5/2018 | Bullish | 31.87 | 5233 | MACD Cross-Up ZeroLine |
| TTM | Tata Motors Ltd | 22/5/2018 | Bullish | 22.91 | 4412 | MACD-H +ve Divergence |
| WY | Weyerhaeuser Company | 22/5/2018 | Bullish | 37.11 | 4338 | MACD Cross-Up Signal |
| TWX | Time Warner Inc. | 22/5/2018 | Bullish | 94.43 | 4280 | MACD Cross-Up ZeroLine |
| DO | Diamond Offshore Drilling, Inc. | 22/5/2018 | Bullish | 19.74 | 4056 | MACD Cross-Up Signal |
| CTSH | Cognizant Technology Solutions Corporation | 22/5/2018 | Bullish | 75.24 | 3968 | MACD Cross-Up Signal |
| D | Dominion Energy, Inc. | 22/5/2018 | Bullish | 63.82 | 3357 | MACD Cross-Up Signal |
| PCG | Pacific Gas & Electric Co. | 22/5/2018 | Bullish | 43.63 | 3069 | MACD Cross-Up Signal |
| PBR | Petroleo Brasileiro S.A.- Petrobras | 22/5/2018 | Bearish | 15.7 | 24254 | MACD Cross-Down Signal |
| FITB | Fifth Third Bancorp | 22/5/2018 | Bearish | 31.89 | 16256 | MACD Cross-Down ZeroLine |
| PSTG | Pure Storage, Inc. | 22/5/2018 | Bearish | 22.25 | 14563 | MACD Cross-Down Signal |
| HPE | Hewlett Packard Enterprise Company | 22/5/2018 | Bearish | 17.41 | 14215 | MACD Cross-Down Signal |
| KMI | Kinder Morgan, Inc. | 22/5/2018 | Bearish | 15.94 | 12943 | MACD Cross-Down ZeroLine |
| MRO | Marathon Oil Corporation | 22/5/2018 | Bearish | 21.54 | 12193 | MACD Cross-Down Signal |
| RRC | Range Resources Corporation | 22/5/2018 | Bearish | 15.45 | 9491 | MACD -ve Divergence |
| WMT | Wal-Mart Stores, Inc. | 22/5/2018 | Bearish | 83.37 | 8033 | MACD Cross-Down Signal |
| BP | BP p.l.c. | 22/5/2018 | Bearish | 47.09 | 7942 | MACD-H -ve Divergence |
| WLL | Whiting Petroleum Corporation | 22/5/2018 | Bearish | 50.48 | 7924 | MACD-H -ve Divergence |
| IGT | International Game Technology | 22/5/2018 | Bearish | 28.46 | 7861 | MACD Cross-Down Signal |
| BGC | General Cable Corporation | 22/5/2018 | Bearish | 29.15 | 7810 | MACD Cross-Down Signal |
| TOL | Toll Brothers Inc. | 22/5/2018 | Bearish | 39.46 | 7724 | MACD-H -ve Divergence |
| ETP | Energy Transfer Partners, L.P. | 22/5/2018 | Bearish | 19.27 | 7574 | MACD-H -ve Divergence |
| JNJ | Johnson & Johnson | 22/5/2018 | Bearish | 122.91 | 7166 | MACD Cross-Down Signal |
| DY | Dycom Industries, Inc. | 22/5/2018 | Bearish | 92.64 | 7158 | MACD Cross-Down Signal |
| BSX | Boston Scientific Corporation | 22/5/2018 | Bearish | 30.27 | 6462 | MACD-H -ve Divergence |
| DVN | Devon Energy Corporation | 22/5/2018 | Bearish | 41.8 | 6301 | MACD Cross-Down Signal |
| NBL | Noble Energy Inc. | 22/5/2018 | Bearish | 36.8 | 6135 | MACD-H -ve Divergence |
| HAL | Halliburton Company | 22/5/2018 | Bearish | 53.24 | 6057 | MACD Cross-Down Signal |
| SLB | Schlumberger N.V. | 22/5/2018 | Bearish | 73.73 | 5671 | MACD-H -ve Divergence |
| NOV | National Oilwell Varco, Inc. | 22/5/2018 | Bearish | 43.69 | 4966 | MACD-H -ve Divergence |
| MOS | Mosaic Company (The) | 22/5/2018 | Bearish | 27.95 | 4465 | MACD-H -ve Divergence |
| WHR | Whirlpool Corporation | 22/5/2018 | Bearish | 164.3 | 4372 | MACD-H -ve Divergence |
| APC | Anadarko Petroleum Corporation | 22/5/2018 | Bearish | 70.52 | 4267 | MACD -ve Divergence |
| ATVI | Activision Blizzard, Inc | 22/5/2018 | Bearish | 71.35 | 4004 | MACD Cross-Down Signal |
| RIO | Rio Tinto Plc | 22/5/2018 | Bearish | 58.96 | 3935 | MACD -ve Divergence |
| BK | Bank Of New York Mellon Corporation (The) | 22/5/2018 | Bearish | 57.59 | 3881 | MACD Cross-Down Signal |
| OXY | Occidental Petroleum Corporation | 22/5/2018 | Bearish | 84.95 | 3817 | MACD Cross-Down Signal |
| NFX | Newfield Exploration Company | 22/5/2018 | Bearish | 29.72 | 3672 | MACD-H -ve Divergence |
| CSX | CSX Corporation | 22/5/2018 | Bearish | 63.47 | 3447 | MACD Cross-Down Signal |
| CAT | Caterpillar, Inc. | 22/5/2018 | Bearish | 156.2 | 3438 | MACD-H -ve Divergence |
| CNQ | Canadian Natural Resources Limited | 22/5/2018 | Bearish | 36.87 | 3383 | MACD -ve Divergence |
| ROKU | Roku, Inc. | 22/5/2018 | Bearish | 34.04 | 3344 | MACD Cross-Down Signal |
| ACAD | ACADIA Pharmaceuticals Inc. | 22/5/2018 | Bearish | 17.25 | 3260 | MACD Cross-Down Signal |
| VLO | Valero Energy Corporation | 22/5/2018 | Bearish | 120.15 | 3244 | MACD-H -ve Divergence |
| HES | Hess Corporation | 22/5/2018 | Bearish | 63.82 | 3239 | MACD Cross-Down Signal |
| FTI | TechnipFMC plc | 22/5/2018 | Bearish | 33.19 | 3231 | MACD-H -ve Divergence |
Moses US Stock ScanYou must understand what MACD is all about before using the results.
AmiBroker Academy.com
Disclaimer:
The above result is for illustration purpose. It is not meant to be used for buy or sell decision. We do not recommend any particular stocks. If particular stocks of such are mentioned, they are meant as demonstration of Amibroker as a powerful charting software and MACD. Amibroker can program to scan the stocks for buy and sell signals.
These are script generated signals. Not all scan results are shown here. The MACD signal should use with price action. Users must understand what MACD and price action are all about before using them. If necessary you should attend a course to learn more on Technical Analysis (TA) and Moving Average Convergence Divergence, MACD.
Once again, the website does not guarantee any results or investment return based on the information and instruction you have read here. It should be used as learning aids only and if you decide to trade real money, all trading decision should be your own.