May 24, 2018
Thanks for visiting the site, AmiBrokerAcademy.com.
US Stock Analysis
British Petroleum listed in NYSE
See chart on moving average, bollinger bands and price action. Picture worth a thousand words. BP PLC ADR stock price.
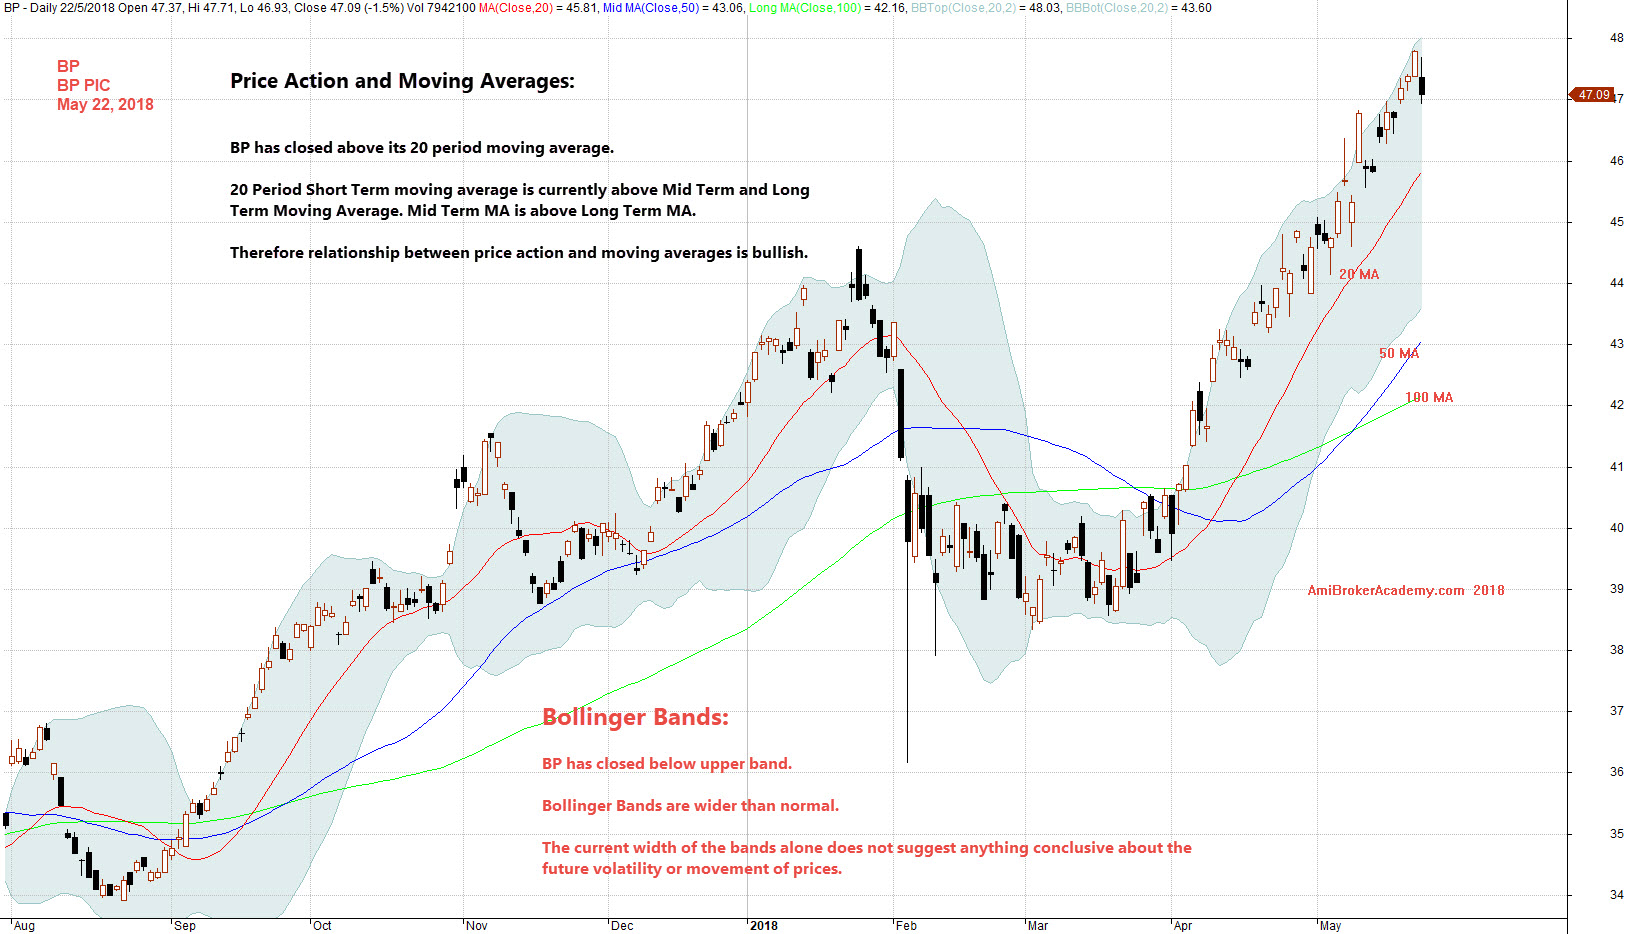
Price Action and Moving Averages:
BP has closed above its 20 period moving average.
20 Period Short Term moving average is currently above Mid Term and Long Term Moving Average. Mid Term MA is above Long Term MA.
Therefore relationship between price action and moving averages is bullish.
Bollinger Bands:
BP has closed below upper band.
Bollinger Bands are wider than normal.
The current width of the bands alone does not suggest anything conclusive about the future volatility or movement of prices.
Manage your Risk:
Trade with eyes open, wait for the price action to retrace before buy.
May 22, 2018 BP and Moving Average and Bollinger Bands
See chart for more. Manage your risk.
Moses Stock Analysis
AmiBrokerAcademy.com
Disclaimer: All information, data and material contained, presented, or provided on amibrokeracademy.com is for educational purposes only. It is not to be construed or intended as providing trading or legal advice. Decisions you make about your trading or investment are important to you and your family, therefore should be made in consultation with a competent financial advisor or professional. We are not financial advisor and do not claim to be. Any views expressed here-in are not necessarily those held by amibrokeracademy.com. You are responsible for your trade decision and wealth being.