23 May, 2018
Thank you for visiting the site. Hope you like the content.
^NYA New York Stock Index Charting
See chart, picture worth a thousand words. Do you see a Bullish ABCD pattern? The bar close above the last high. Can the resistance turns support.
Manager your trade risk.
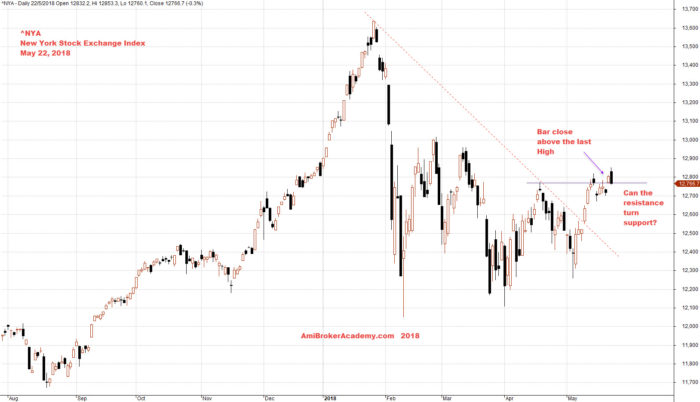
May 22, 2018 New York Stock Exchange Index Charting
Free MACD Scan One-day US Stock MACD Screening Results on May 21 2018
Remember all setup can fail. This is true for all indicators. It is also true for MACD signals setup. See some of the MACD setup fail examples on this website.
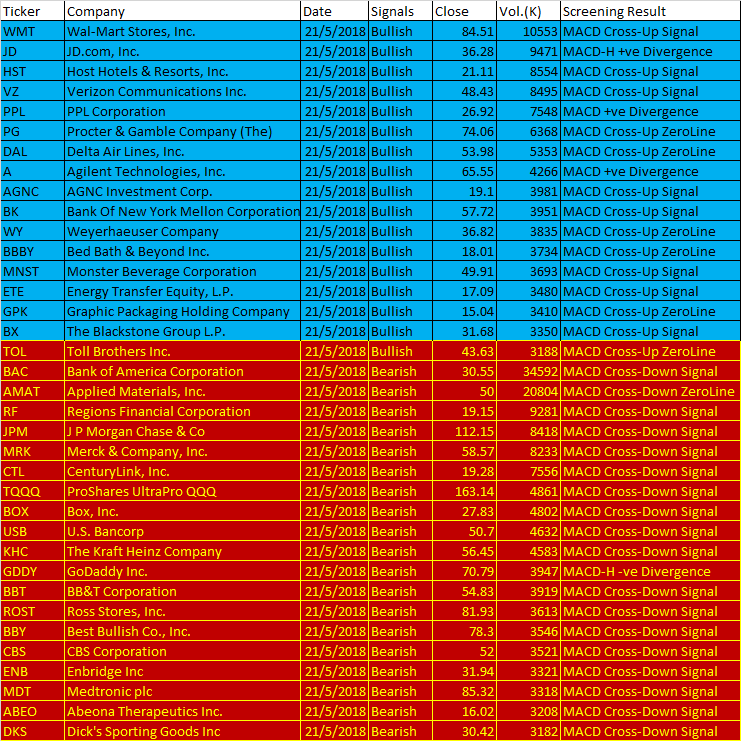
May 21, 2018 US Stock 1-Day MACD Signals
These are the six types of MACD Signals:
- MACD line crosses above MACD signal – Bullish trend
- MACD line crosses above zero line – Bullish trend
- MACD Histogram +ve Divergence – Bullish trend
- MACD line crosses below MACD signal – Bearish trend
- MACD line crosses below zero line – Bearish trend
- MACD Histogram -ve Divergence – Bearish trend
| Ticker | Company | Date | Signals | Close | Vol.(K) | Screening Result |
| WMT | Wal-Mart Stores, Inc. | 21/5/2018 | Bullish | 84.51 | 10553 | MACD Cross-Up Signal |
| JD | JD.com, Inc. | 21/5/2018 | Bullish | 36.28 | 9471 | MACD-H +ve Divergence |
| HST | Host Hotels & Resorts, Inc. | 21/5/2018 | Bullish | 21.11 | 8554 | MACD Cross-Up Signal |
| VZ | Verizon Communications Inc. | 21/5/2018 | Bullish | 48.43 | 8495 | MACD Cross-Up Signal |
| PPL | PPL Corporation | 21/5/2018 | Bullish | 26.92 | 7548 | MACD +ve Divergence |
| PG | Procter & Gamble Company (The) | 21/5/2018 | Bullish | 74.06 | 6368 | MACD Cross-Up ZeroLine |
| DAL | Delta Air Lines, Inc. | 21/5/2018 | Bullish | 53.98 | 5353 | MACD Cross-Up ZeroLine |
| A | Agilent Technologies, Inc. | 21/5/2018 | Bullish | 65.55 | 4266 | MACD +ve Divergence |
| AGNC | AGNC Investment Corp. | 21/5/2018 | Bullish | 19.1 | 3981 | MACD Cross-Up Signal |
| BK | Bank Of New York Mellon Corporation (The) | 21/5/2018 | Bullish | 57.72 | 3951 | MACD Cross-Up Signal |
| WY | Weyerhaeuser Company | 21/5/2018 | Bullish | 36.82 | 3835 | MACD Cross-Up ZeroLine |
| BBBY | Bed Bath & Beyond Inc. | 21/5/2018 | Bullish | 18.01 | 3734 | MACD Cross-Up ZeroLine |
| MNST | Monster Beverage Corporation | 21/5/2018 | Bullish | 49.91 | 3693 | MACD Cross-Up Signal |
| ETE | Energy Transfer Equity, L.P. | 21/5/2018 | Bullish | 17.09 | 3480 | MACD Cross-Up Signal |
| GPK | Graphic Packaging Holding Company | 21/5/2018 | Bullish | 15.04 | 3410 | MACD Cross-Up ZeroLine |
| BX | The Blackstone Group L.P. | 21/5/2018 | Bullish | 31.68 | 3350 | MACD Cross-Up Signal |
| TOL | Toll Brothers Inc. | 21/5/2018 | Bullish | 43.63 | 3188 | MACD Cross-Up ZeroLine |
| BAC | Bank of America Corporation | 21/5/2018 | Bearish | 30.55 | 34592 | MACD Cross-Down Signal |
| AMAT | Applied Materials, Inc. | 21/5/2018 | Bearish | 50 | 20804 | MACD Cross-Down ZeroLine |
| RF | Regions Financial Corporation | 21/5/2018 | Bearish | 19.15 | 9281 | MACD Cross-Down Signal |
| JPM | J P Morgan Chase & Co | 21/5/2018 | Bearish | 112.15 | 8418 | MACD Cross-Down Signal |
| MRK | Merck & Company, Inc. | 21/5/2018 | Bearish | 58.57 | 8233 | MACD Cross-Down Signal |
| CTL | CenturyLink, Inc. | 21/5/2018 | Bearish | 19.28 | 7556 | MACD Cross-Down Signal |
| TQQQ | ProShares UltraPro QQQ | 21/5/2018 | Bearish | 163.14 | 4861 | MACD Cross-Down Signal |
| BOX | Box, Inc. | 21/5/2018 | Bearish | 27.83 | 4802 | MACD Cross-Down Signal |
| USB | U.S. Bancorp | 21/5/2018 | Bearish | 50.7 | 4632 | MACD Cross-Down Signal |
| KHC | The Kraft Heinz Company | 21/5/2018 | Bearish | 56.45 | 4583 | MACD Cross-Down Signal |
| GDDY | GoDaddy Inc. | 21/5/2018 | Bearish | 70.79 | 3947 | MACD-H -ve Divergence |
| BBT | BB&T Corporation | 21/5/2018 | Bearish | 54.83 | 3919 | MACD Cross-Down Signal |
| ROST | Ross Stores, Inc. | 21/5/2018 | Bearish | 81.93 | 3613 | MACD Cross-Down Signal |
| BBY | Best Bullish Co., Inc. | 21/5/2018 | Bearish | 78.3 | 3546 | MACD Cross-Down Signal |
| CBS | CBS Corporation | 21/5/2018 | Bearish | 52 | 3521 | MACD Cross-Down Signal |
| ENB | Enbridge Inc | 21/5/2018 | Bearish | 31.94 | 3321 | MACD Cross-Down Signal |
| MDT | Medtronic plc | 21/5/2018 | Bearish | 85.32 | 3318 | MACD Cross-Down Signal |
| ABEO | Abeona Therapeutics Inc. | 21/5/2018 | Bearish | 16.02 | 3208 | MACD Cross-Down Signal |
| DKS | Dick’s Sporting Goods Inc | 21/5/2018 | Bearish | 30.42 | 3182 | MACD Cross-Down Signal |
Moses US Stock ScanYou must understand what MACD is all about before using the results.
AmiBroker Academy.com
Disclaimer:
The above result is for illustration purpose. It is not meant to be used for buy or sell decision. We do not recommend any particular stocks. If particular stocks of such are mentioned, they are meant as demonstration of Amibroker as a powerful charting software and MACD. Amibroker can program to scan the stocks for buy and sell signals.
These are script generated signals. Not all scan results are shown here. The MACD signal should use with price action. Users must understand what MACD and price action are all about before using them. If necessary you should attend a course to learn more on Technical Analysis (TA) and Moving Average Convergence Divergence, MACD.
Once again, the website does not guarantee any results or investment return based on the information and instruction you have read here. It should be used as learning aids only and if you decide to trade real money, all trading decision should be your own.