March 11, 2018
BAT – Baidu 百度, Alibaba 阿里巴巴 and Tencent 腾讯
We posted Tencent 腾讯 and Baidu百度 chart analysis, now we will analyse Alibaba 阿里巴巴 charting.
US Stock Chart Analysis
Ticket ID: BABA Alibaba Group Holding 阿里巴巴 Charting and Trendline
Reading chart using trendline,
Here, we see the price action after the pullback in 2016, the stock price was moving in a small steps for the beginning. After mid 2017, the price action starts to be wider. But, after 2018 high, the stock price begin to form lower high. So, the trend ending. Will see.
Manage your risk!
Powerful Chart Software – AmiBroker
The following chart is produced using AmiBroker charting software. It is a powerful chart software. Anything, finance ticket you could download from Yahoo! Finance you could plot them, those you are interested all in a chart, so you could analyse them. See chart below like the popular Bitcoin.
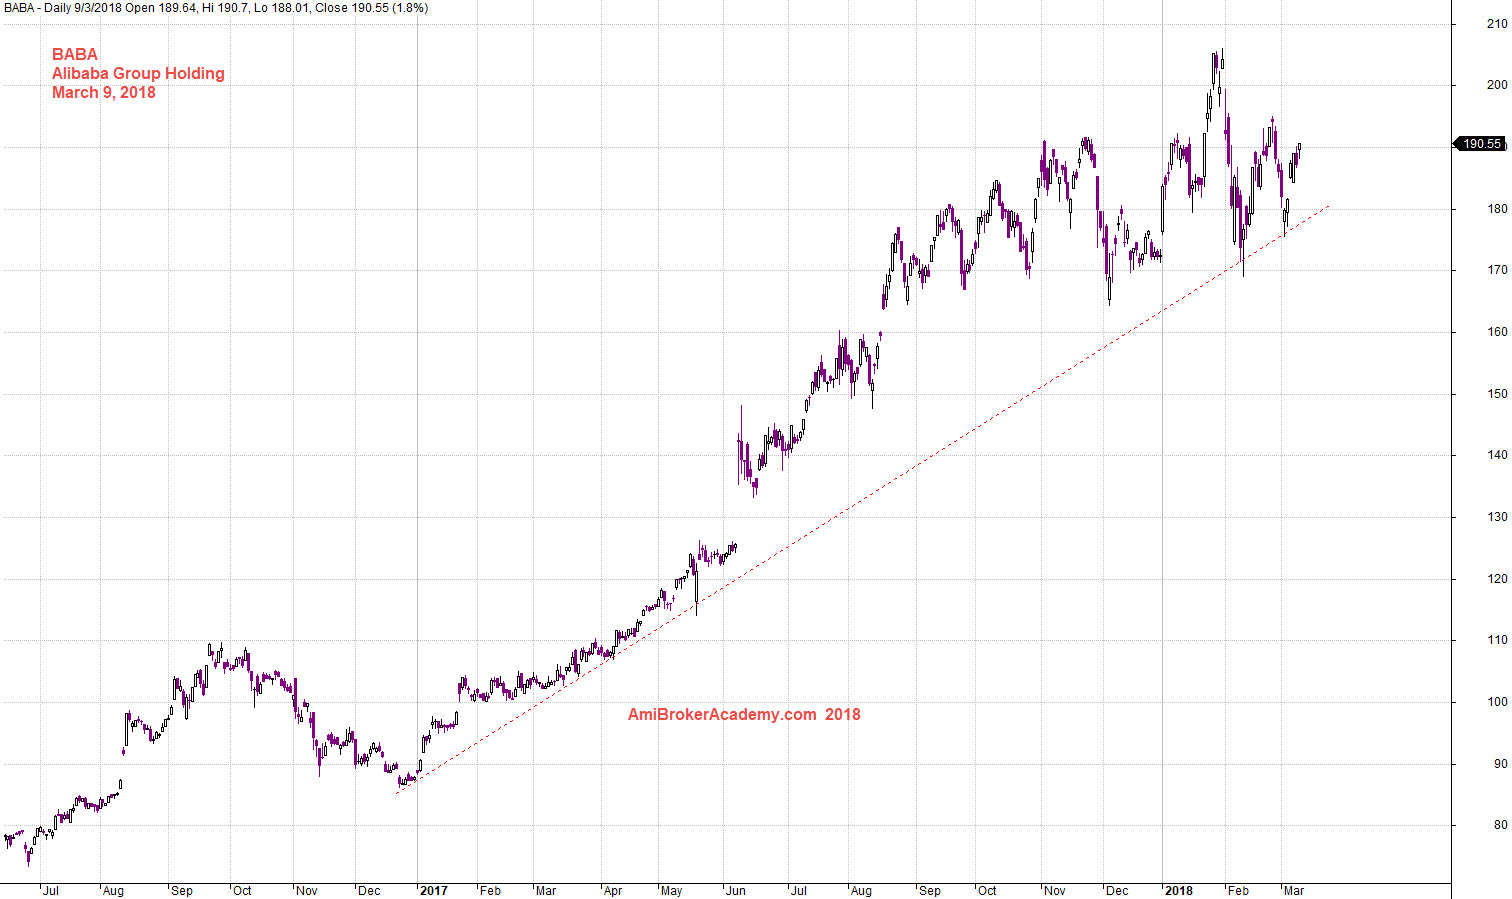
March 9, 2018 Alibaba Group Holding and Trendline
BABA 阿里巴巴 Charting and Fibonacci Retracement
Swing low to high, and draw a Fibo Retracenebt, see chart. The price action pullback to test 61.8%. look left you will see the price had test the same support for many times.
Manage your risk.
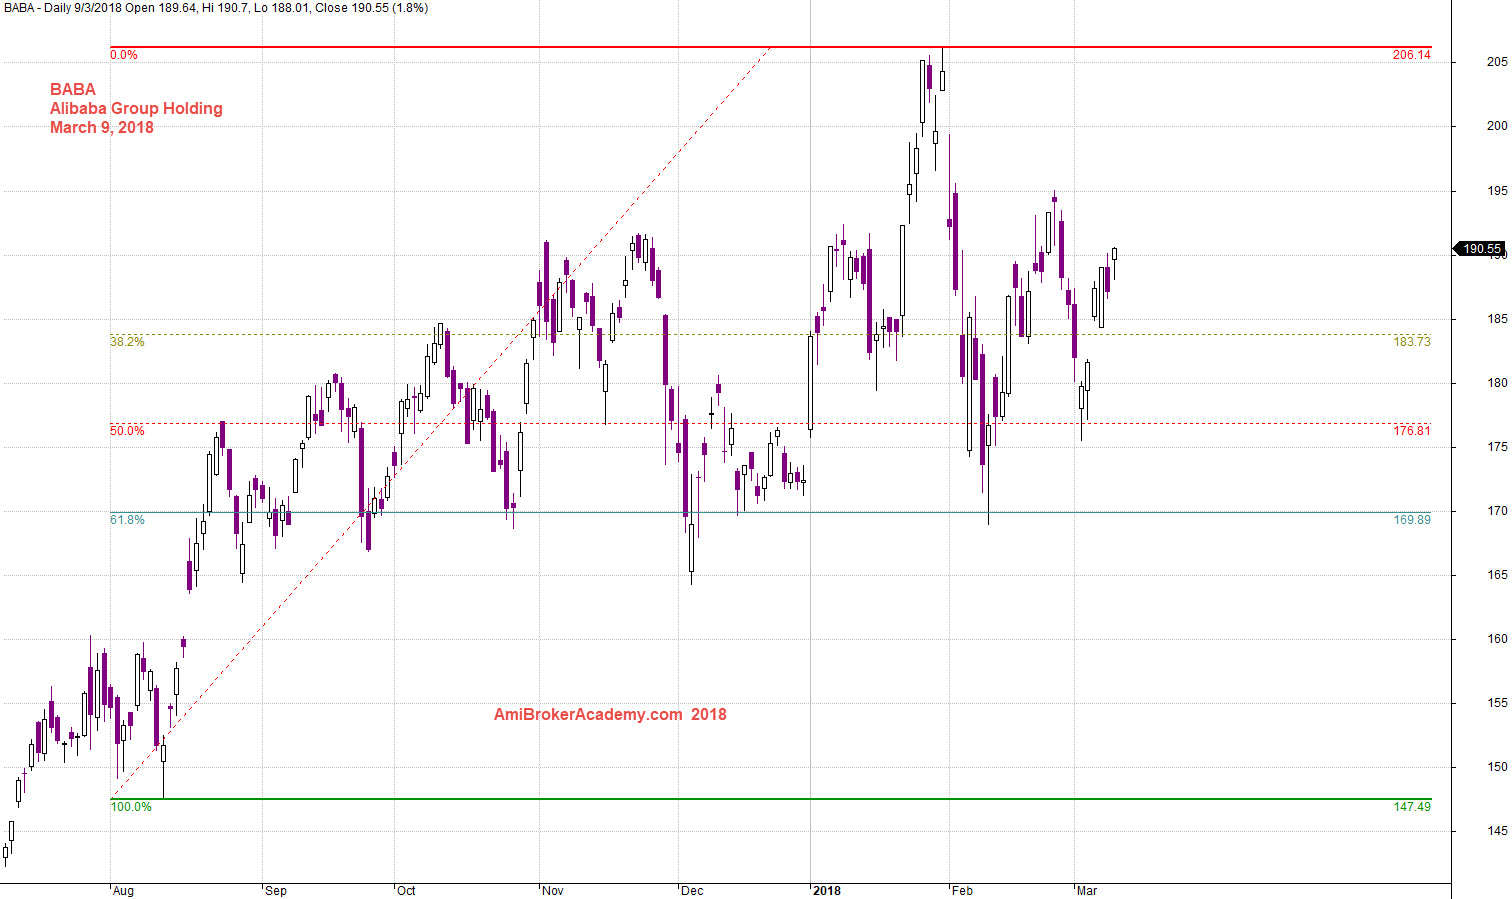
20180309 Alibaba Group Holding and Fibo Retracement
BABA 阿里巴巴 Charting and Fibonacci Extension
Again study the chart using Fibonacci still, but we draw the Fibo extension, We see the price breakout 261.8%, but the price action fail and fall below 261.8%. Those whom rush in to buy, are all trapped. See chart.
Manage your risk.
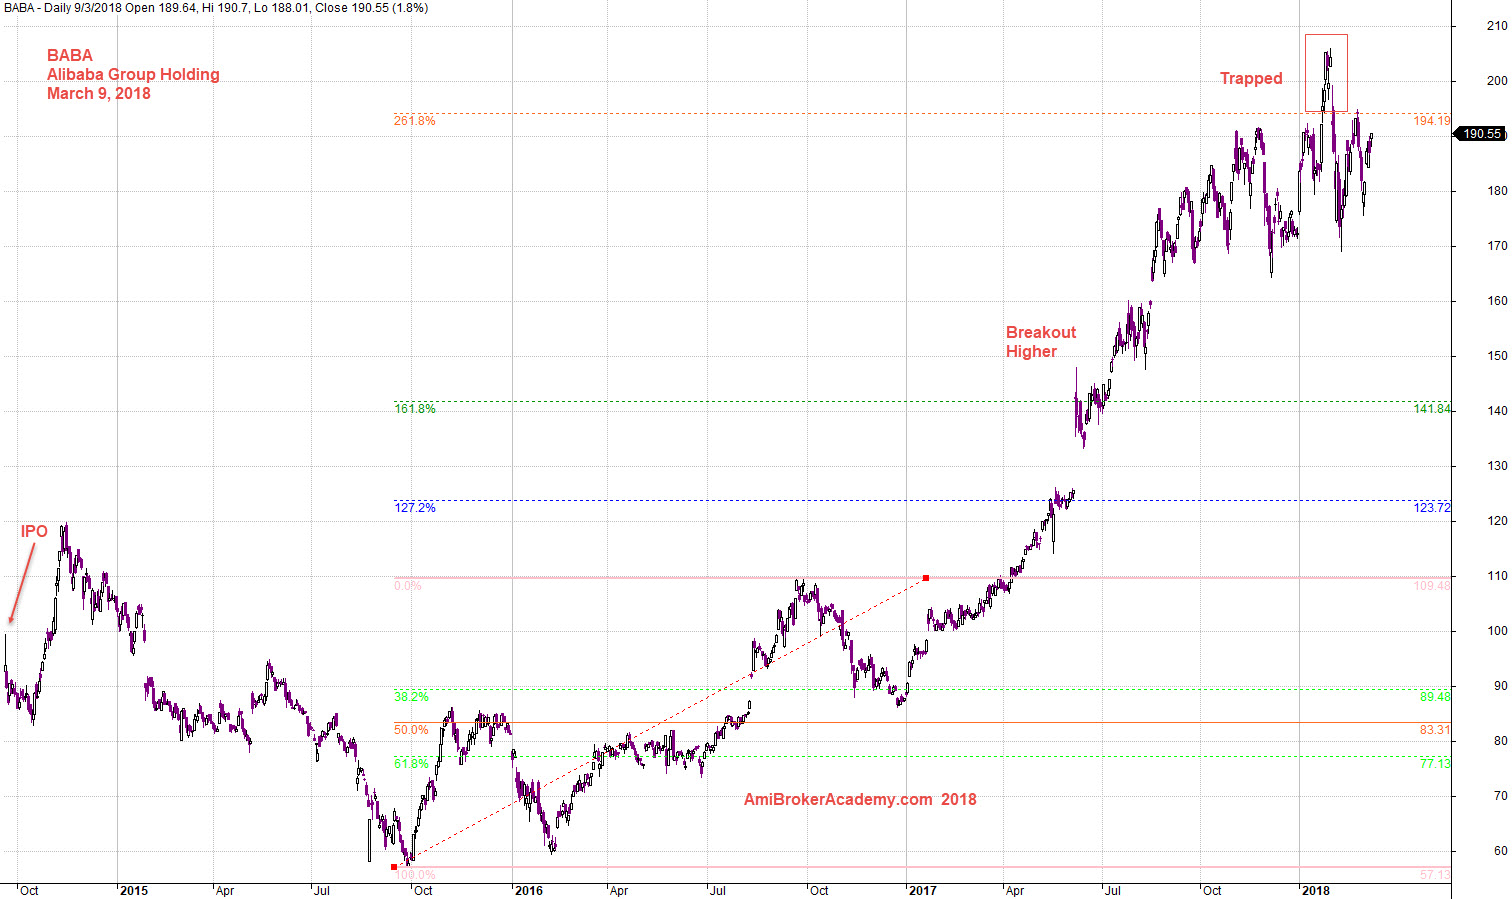
20180309 Alibaba Group Holding and Fibo Extension
Moses US Stock Chart Analysis
AmiBrokerAcademy.com
Disclaimer
The above result is for illustration purpose. It is not meant to be used for buy or sell decision. We do not recommend any particular stocks. If particular stocks of such are mentioned, they are meant as demonstration of Amibroker as a powerful charting software and MACD. Amibroker can program to scan the stocks for buy and sell signals.
These are script generated signals. Not all scan results are shown here. The MACD signal should use with price action. Users must understand what MACD and price action are all about before using them. If necessary you should attend a course to learn more on Technical Analysis (TA) and Moving Average Convergence Divergence, MACD.
Once again, the website does not guarantee any results or investment return based on the information and instruction you have read here. It should be used as learning aids only and if you decide to trade real money, all trading decision should be your own.