1 March, 2018

13th Day CNY (Photo Source: What’s Apps Group)
Powerful Chart Software – AmiBroker
The following chart is produced using AmiBroker charting software. It is a powerful chart software. You plot the stocks you are interested all in one chart, as long as you still could read them. See chart below. Thereafter slowly climb up, step by step.
US Stock Analysis
AOSL Alpha & Omega Semiconductor and Fibonacci Extension
Study the chart, swing high to low, from November high to April low, and the extension finally hits 127%. If you have not sold your shares at 24 dollars, now you have to wait long long lah (Singlish, Singapore English. Recently realize that there is also Chinlish, Chinese English. Looks like the world is changing.) It took twelve months to bring the price action down to the current low, will it take 12 months or more to back to test 24 dollars. Will see.
Manage your risk!
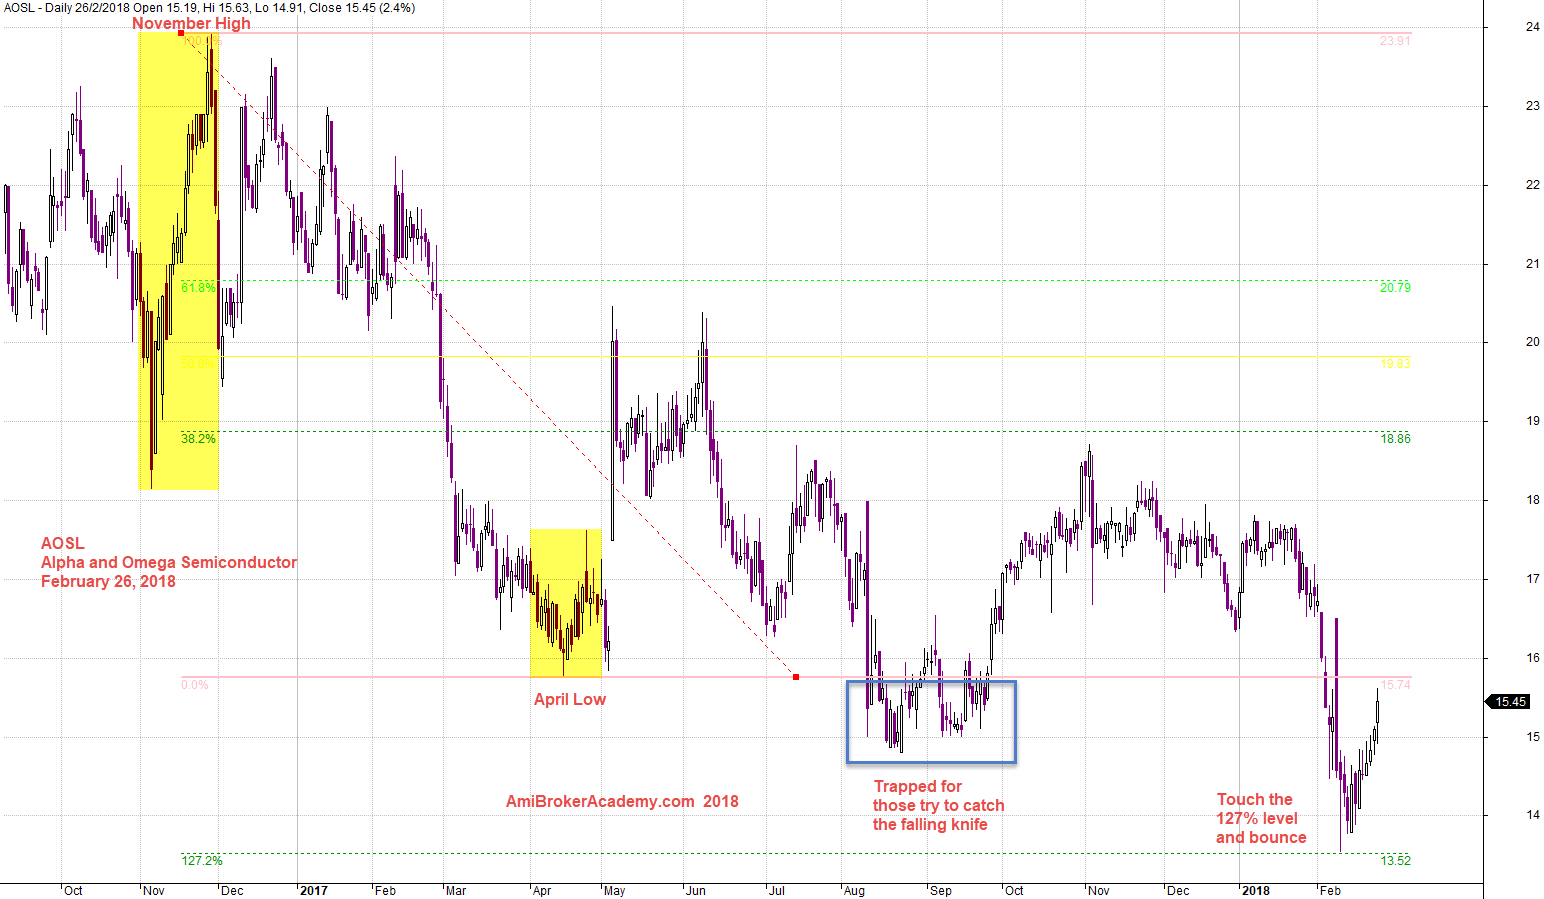
February 26, 2018 Alpha and Omega Semiconductor and Fibo Retracement Swing High to Low
AOSL Alpha and Omega Semiconductor and MACD
From a different view, study chart from MACD indicator and see what the MACD has to say. We see a MACD Cross up signal, but the MACD and MACD Histogram are below zeroline, so still very bearish bias.
Manage your risk!
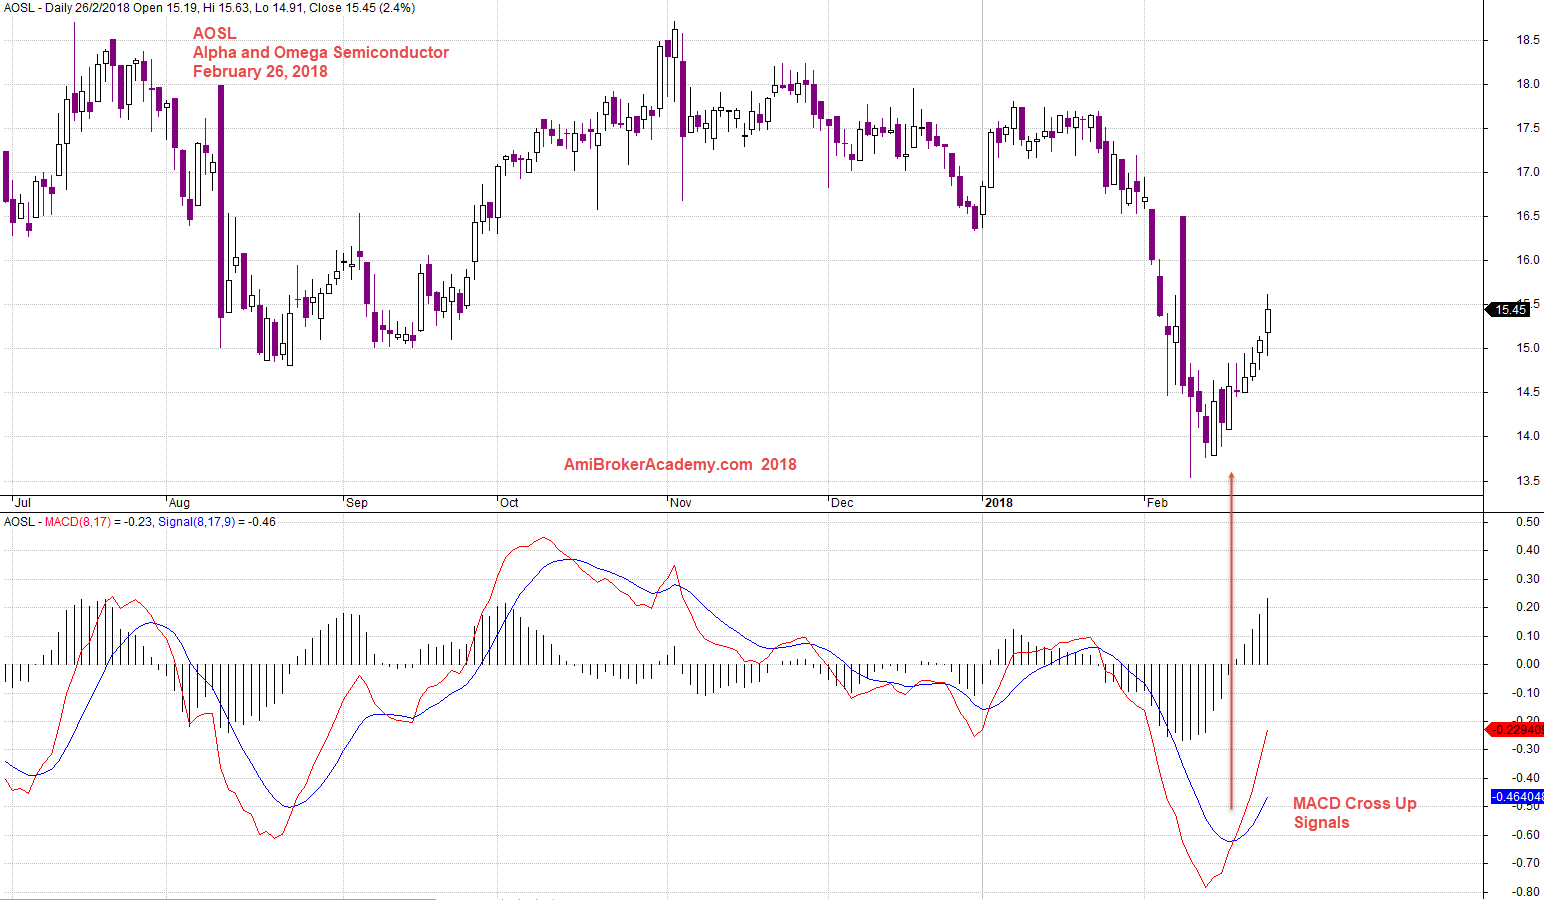
20180226 Alpha and Omega Semiconductor and MACD
Moses US Stock Analysis
AmiBrokerAcademy.com
Disclaimer
The above result is for illustration purpose. It is not meant to be used for buy or sell decision. We do not recommend any particular stocks. If particular stocks of such are mentioned, they are meant as demonstration of Amibroker as a powerful charting software and MACD. Amibroker can program to scan the stocks for buy and sell signals.
These are script generated signals. Not all scan results are shown here. The MACD signal should use with price action. Users must understand what MACD and price action are all about before using them. If necessary you should attend a course to learn more on Technical Analysis (TA) and Moving Average Convergence Divergence, MACD.
Once again, the website does not guarantee any results or investment return based on the information and instruction you have read here. It should be used as learning aids only and if you decide to trade real money, all trading decision should be your own.