1 March, 2018

Liahhe Zaobao (screen capture)
The following was the heading on February 27 Liahe Zaobao Finance
美股推动海指上扬 三大银行股创新高
The report said, influenced by the US Stocks rally, the last two trading also join the rally; led by the three major local banks. STI was up by 22.63 points a 0.64% increase, the STI close at 3555.85 level. …
在美股涨势的带动下,本地股市连续两个交易日走高,三大银行股创下收盘新高。
新加坡海峡时报指数昨天上扬22.63点或0.64%,收报3555.85点。全场成交量16.7亿股,成交额13.2亿元,上升股263只,下跌股216只
Oscillator Moving Average Convergence Divergence
MACD is a popular trend following momentum indicator that shows the relationship of two moving averages of prices action; the MACD line and signal line.
Four MACD Signals:
- Crossovers – Sell Strategy, MACD crosses below the signal line. Buy Strategy, MACD rallies above the signal line. It is advisable to wait for confirmation to reduce possible whipsaw.
- Divergence – The security price action diverges from the MACD. It signals the end of the current trend.
- Cross Zero Line – MACD moves above or below zero line. Upward trend: Cross above zero line, short MA above long MA. Downward trend: Cross below zero line, short MA below long MA.
- Dramatic rise or fall – MACD rises or decline dramatically – when the shorter moving average pulls away from the longer-term moving average – Oversold or Overbought.
Free One-day Singapore Stock MACD Screening Results for 27 February 2018
Remember all setup can fail. This is true for all indicators. It is also true for MACD signals setup. See some of the MACD setup fail examples on this website.
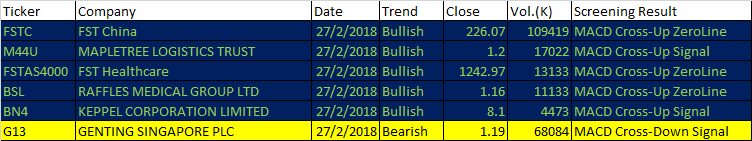
February 27, 2018 Singapore Stock One-day MACD Screener Signals
- MACD line crosses above MACD signal – Bullish trend
- MACD line crosses above zero line – Bullish trend
- MACD Histogram +ve Divergence – Bullish trend
- MACD line crosses below MACD signal – Bearish trend
- MACD line crosses below zero line – Bearish trend
- MACD Histogram -ve Divergence – Bearish trend
| Ticker | Company | Date | Trend | Close | Vol.(K) | Screening Result |
| FSTC | FST China | 27/2/2018 | Bullish | 226.07 | 109419 | MACD Cross-Up ZeroLine |
| M44U | MAPLETREE LOGISTICS TRUST | 27/2/2018 | Bullish | 1.2 | 17022 | MACD Cross-Up Signal |
| FSTAS4000 | FST Healthcare | 27/2/2018 | Bullish | 1242.97 | 13133 | MACD Cross-Up ZeroLine |
| BSL | RAFFLES MEDICAL GROUP LTD | 27/2/2018 | Bullish | 1.16 | 11133 | MACD Cross-Up ZeroLine |
| BN4 | KEPPEL CORPORATION LIMITED | 27/2/2018 | Bullish | 8.1 | 4473 | MACD Cross-Up Signal |
| G13 | GENTING SINGAPORE PLC | 27/2/2018 | Bearish | 1.19 | 68084 | MACD Cross-Down Signal |
Have fun!Users must understand what MACD is all about before using the results.
Moses Singapore Stock MACD Screening Signals
AmiBroker Academy.com
Disclaimer:
The above result is for illustration purpose. It is not meant to be used for buy or sell decision. We do not recommend any particular stocks. If particular stocks of such are mentioned, they are meant as demonstration of Amibroker as a powerful charting software and MACD. Amibroker can program to scan the stocks for buy and sell signals.
These are script generated signals. Not all scan results are shown here. The MACD signal should use with price action. Users must understand what MACD and price action are all about before using them. If necessary you should attend a course to learn more on Technical Analysis (TA) and Moving Average Convergence Divergence, MACD.
Once again, the website does not guarantee any results or investment return based on the information and instruction you have read here. It should be used as learning aids only and if you decide to trade real money, all trading decision should be your own.