Dow Jones Index, DJI bullish or bearish? In short term, DJI is bearish. Will it find a support to slow down and re-bounce? The Dow Jones Index 20-days EMA broke above the 100 day and 200 days EMA completed the Golden cross. But it was resisted by the trend line, see chart for details. Although it has a Golden cross it was not able to break up the trend line. Now the 20 days EMA is dropped down and touch both 100 and 200 EMA. Will it cross down and complete the Dead cross? Will see.
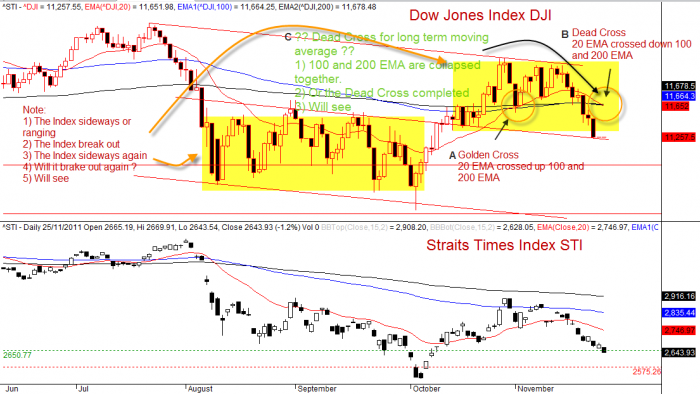
It is a very clear that the 100 days and 200 days EMA has moved to together and collapse as one. Although 100 EMA is slightly lower. When the 20 EMA completed the cross, 100 and 200 EMA widen with 100 EMA below, the index is below the moving averages and all are pointing south. The index will be bearish. As long as the index stay below the three moving average the market will continue to be bearish.
In a bearish situation for index there are still stocks or good stocks will be bullish. The index is just a benchmark of the market, Dow Jones market.
The market moves in zigzag, so the price or index will at time retrace up touch or cross the moving average when the news and economy are good. When will the bull appear? Not until a new Golden Crosses of all three EMA are completed and at least the faster EMA are pointing up and the slower EMA are slopping up. At this point the index should be flying above the three EMA most of the time.
Moving Average is a simple way to see the market trend. Either it is in an up trend or a down trend, and in long or short term. When the market is ranging or sideways, the moving averages will be flat and come close to each others. When the market trends, the moving average will be wide and open, either slopping up or down.
Technical Analysis is away to analyze the market. It does not provide the yes and no answer. Because TA is both the art and science. It is a science using the math and geometry to study the probability of the future market trend. Technical Analysis studies the data and volume. It is a left brain process. However, Technical Analysis is also an act because it involve human. The human is creative, and emotion. Therefore the trade itself, any trading decision is an art.
Hope the information is useful to many.
Disclaimer
The above result is for illustration purpose. It is not meant to be used for buy or sell decision. We do not recommend any particular stocks. If particular stocks or indices of such are mentioned, they are meant as demonstration of Amibroker as a powerful charting software. Example, it can insert another price or index such as Dow Jones Index, DJI to compare with the stocks or index you are studying.
Once again, the website does not guarantee any results or investment return based on the information and instruction you have read here. Please get your advice from the professional financial consultant.