How will help you to keep on a path to be successful in trading?
Many successful traders keep their trade simple; using moving averages golden cross and dead cross to identify the market trend. Golden Cross is the fast moving average (eg 50 EMA) cross up slow moving average (eg 200 EMA) and the moving averages will act as a support. For Dead Cross is the fast moving average cross below slow moving average and the moving averages will acts as a resistance.
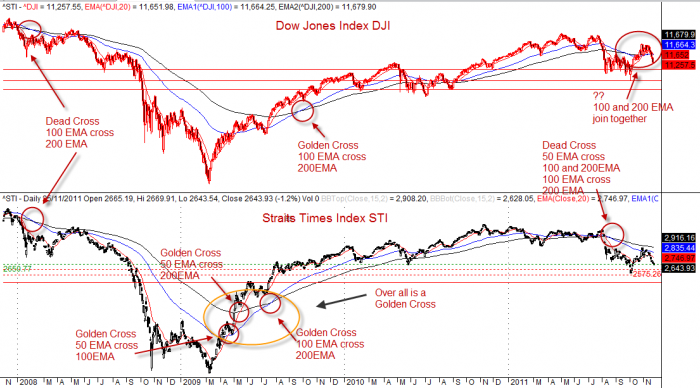
Let’s examine Singapore Stocks Market Index, Straits Times Index (STI) and Dow Jones Index (DJI). See charts for illustration. The chart is plotted using AmiBroker charting software and EOD data from Datafolio of Technical Analysis LLP.
Golden Cross, Dead Cross, Dow Jones Index, Straits Times Index, DJI, STI
You will appreciate the crosses have very significant meaning to many of the traders and investors. Between the recent Golden cross and the Dead cross, it was nearly two years since 2009 August. It was Golden cross first before the Dead cross. The market has been rallies after the Golden cross. You can find moving averages act as support for the index. Now market has a Dead cross. Before the next Golden cross, it would expect the market to be more bearish and the moving averages to act as resistance now.
The market will continue to remain soft and
- Some rallies but more like a retracement.
- The moving averages of 50, 100 and 200 days will now act as a resistance
- For long term investors it will be a challenge to hold on any ‘good’ stocks.
Will there be opportunities to trade and invest? Despite the bearish market trend, the prices of stocks still move in zigzag due to the traders and investors fear and greed.
Technical Analysis do not have the yes and no answer, it is a science using the math and geometry to study the probability of the future market trend. It is a left brain process. Technical Analysis studies the data and volume. However, it is an act because it involve human. The human is creative, and emotion.
Disclaimer
The above result is for illustration purpose. It is not meant to be used for buy or sell decision. We do not recommend any particular stocks. If particular stocks or indices of such are mentioned, they are meant as demonstration of Amibroker as a powerful charting software. Example, it can insert another price or index such as Dow Jones Index, DJI.
Once again, the website does not guarantee any results or investment return based on the information and instruction you have read here. Please get your advice from the professional financial consultant.