18 August, 2019
Welcome to AmiBrokerAcademy.com. Thanks for visiting the site.
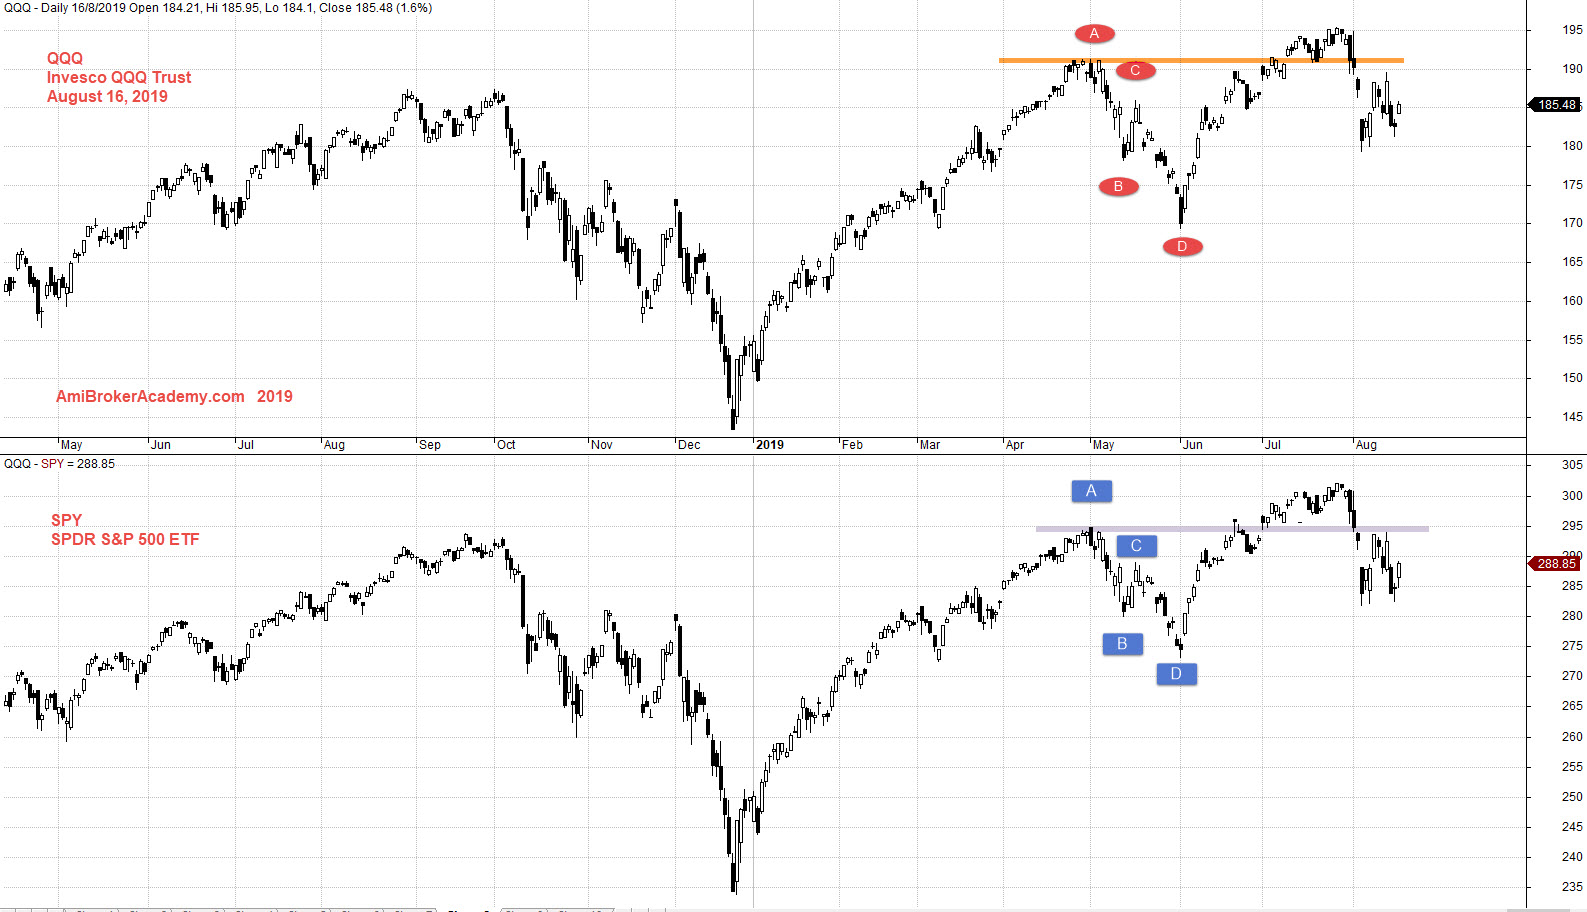
QQQ and SPY Correlation Stock Charting
Study Invesco QQQ Trust and SPDR S&P 500 ETF Stock chart correlation.
See chart, picture worth a thousand words.
Both stock chart wave movement looks similar. See chart.
We could see an ABCD pullback to send the price action to the low in 2019.
Many of the new trader may thought they can graduate and successful in their trading. As when the buy at any point after 2019, the price action goes higher. And May send their confident to the low. You have to understand many of the professional trader until today, still feel they are not good enough.
I recall, back in the late 2000, I have a course mate after took the training in forex trading, after few weeks of successful winning trade. He begin to become a coach to number of the course mate. Next he fire his boss, to become a professional trader. Shortly after, we can not even able to contact him. Suspect, he may have hit a bad trade.
So, the key to trading is what is your market math. What if you continue to hit a few bad trade, how could continue to be strong and able to overcome the lost. Continue to win may not be a good news to some of your. Have fun!
Manage your risk.
Trade with your eyes open.
Moses Stock Observation
AmiBrokerAcademy.com
Disclaimer
The above result is for illustration purpose. It is not meant to be used for buy or sell decision. We do not recommend any particular stocks. If particular stocks of such are mentioned, they are meant as demonstration of Amibroker as a powerful charting software and MACD. Amibroker can program to scan the stocks for buy and sell signals.
These are script generated signals. Not all scan results are shown here. The MACD signal should use with price action. Users must understand what MACD and price action are all about before using them. If necessary you should attend a course to learn more on Technical Analysis (TA) and Moving Average Convergence Divergence, MACD.
Once again, the website does not guarantee any results or investment return based on the information and instruction you have read here. It should be used as learning aids only and if you decide to trade real money, all trading decision should be your own.