20 August, 2019
Welcome to AmiBrokerAcademy.com. Thanks for visiting the site.
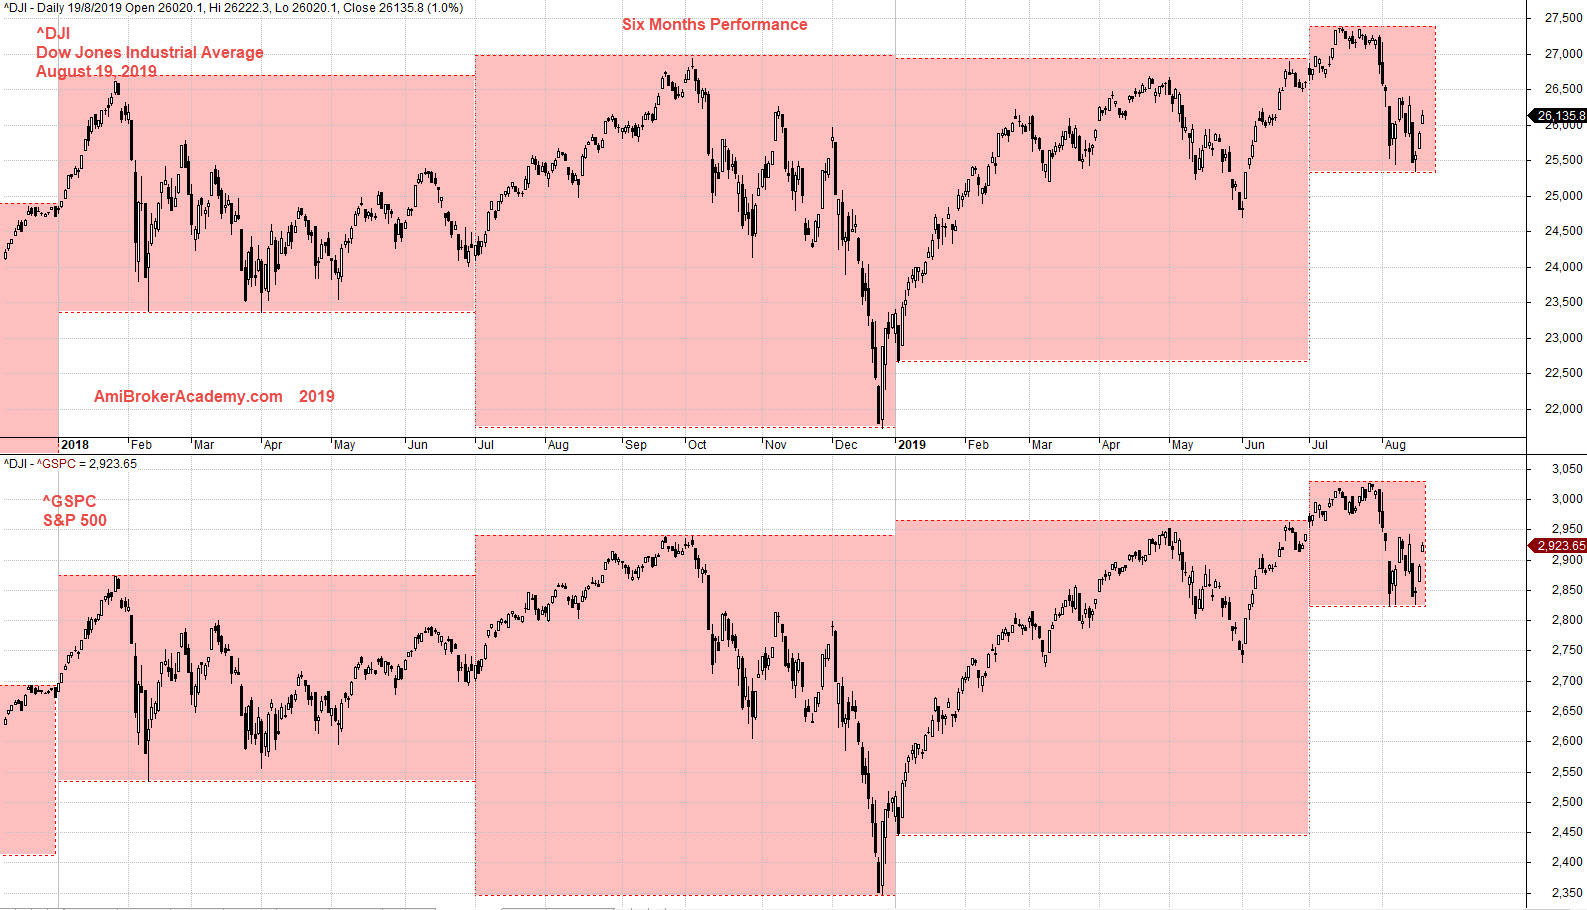
Dow Jones Industrial Average and S&P 500 Correlation Stock Charting
Study Dow Jones Industrial Average and S&P 500 Stock chart six months performance.
See chart, picture worth a thousand words.
We use Darvas Box on a six months basis. Look left to year 2018. See the price action contains within the six months period.
2019 first six months price action is still within the 2018 last six months momentum. 2018 last six months momentum is larger than its first six months market reaction.
Study the correlation between Dow Jones Industrial Average and S&P 500. You will find it is more or less about the same.
Trade with your eyes open.
Moses Stock Observation
AmiBrokerAcademy.com
Disclaimer
The above result is for illustration purpose. It is not meant to be used for buy or sell decision. We do not recommend any particular stocks. If particular stocks of such are mentioned, they are meant as demonstration of Amibroker as a powerful charting software and MACD. Amibroker can program to scan the stocks for buy and sell signals.
These are script generated signals. Not all scan results are shown here. The MACD signal should use with price action. Users must understand what MACD and price action are all about before using them. If necessary you should attend a course to learn more on Technical Analysis (TA) and Moving Average Convergence Divergence, MACD.
Once again, the website does not guarantee any results or investment return based on the information and instruction you have read here. It should be used as learning aids only and if you decide to trade real money, all trading decision should be your own.