May 8, 2018
Thanks for visiting the site, AmiBrokerAcademy.com.
US Stock Analysis – Chart Stories
DIS Walt Disney Company and Support Resistance
Study Walt Disney Company stock price using Support Resistance, monthly support resistance. In other words, the month high low, see the chart, the breakout of the price action. Picture worth a thousand words, manage your risk.
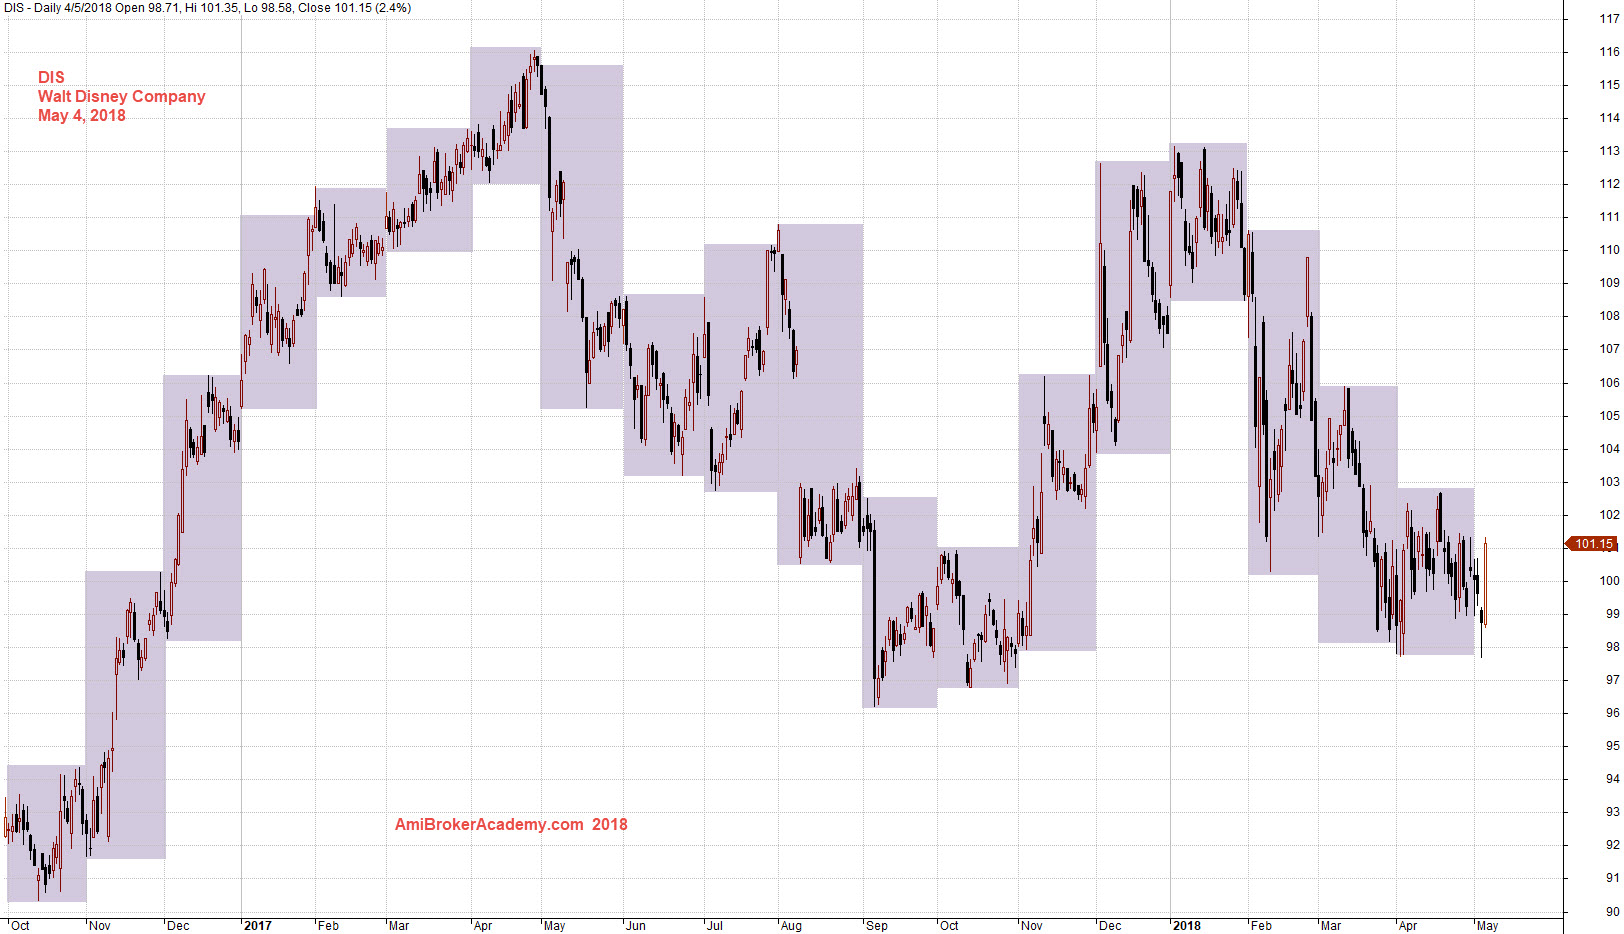
May 4, 2018 Walt Disney Company and Support Resistance
DIS Walt Disney Company and H M Gartley ABCD Pattern
Study Walt Disney Company stock price using H M Gartley ABCD pattern, see chart.
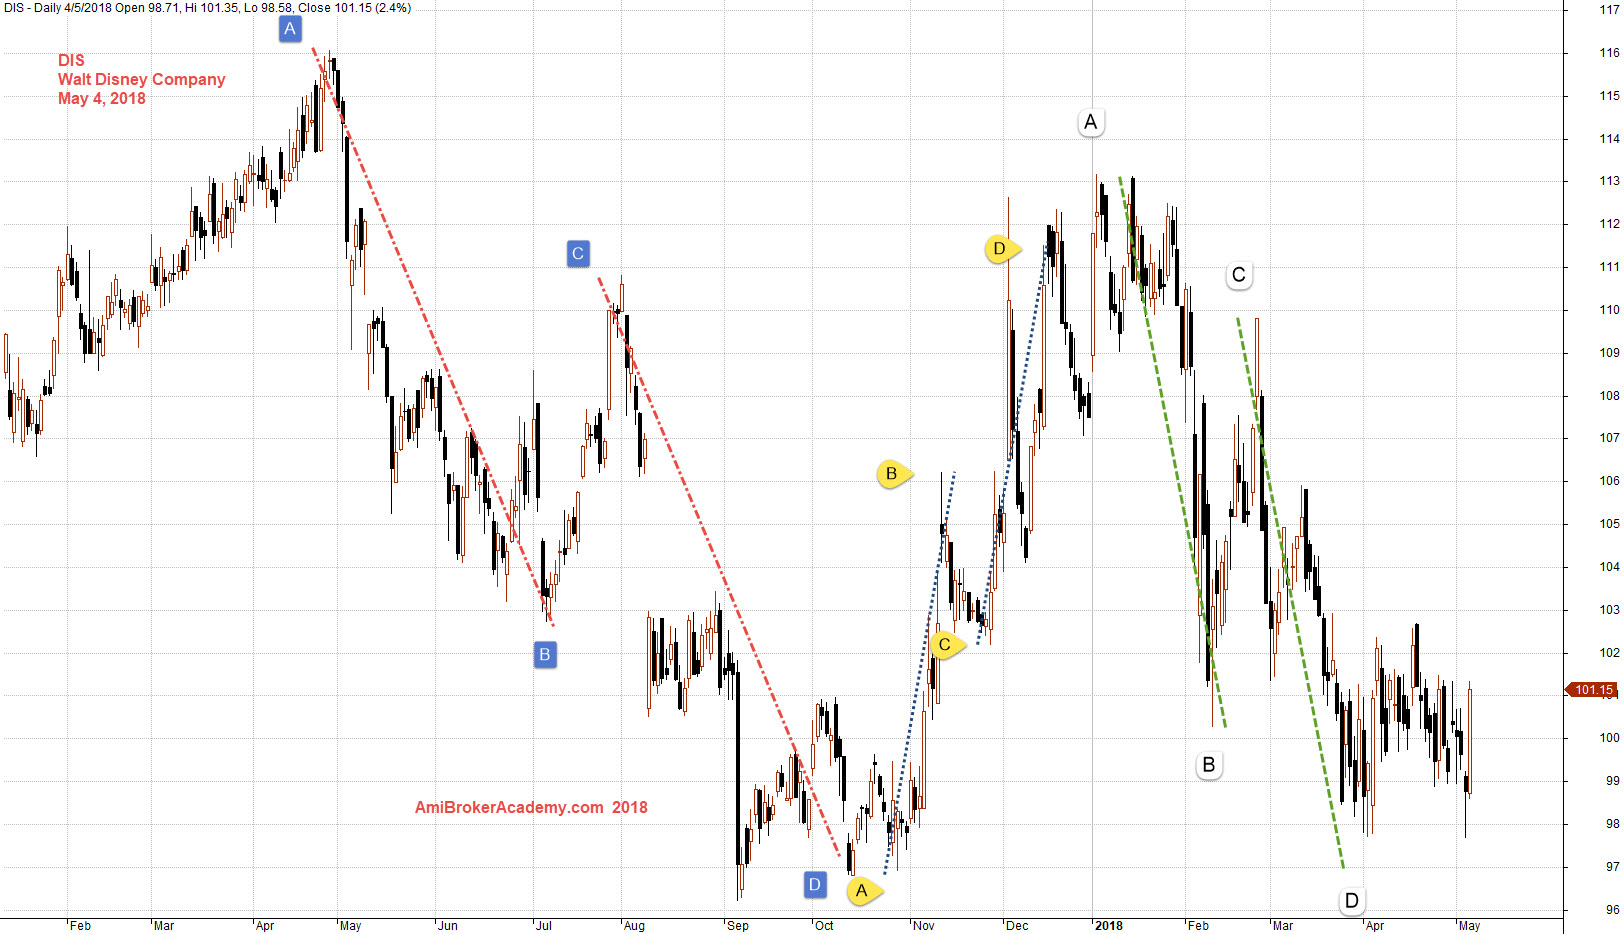
May 4, 2018 Walt Disney Company and ABCD
DIS Walt Disney Company and Fibonacci
Study Walt Disney Company stock price using Fibonacci, swing high to low. Manage your risk.
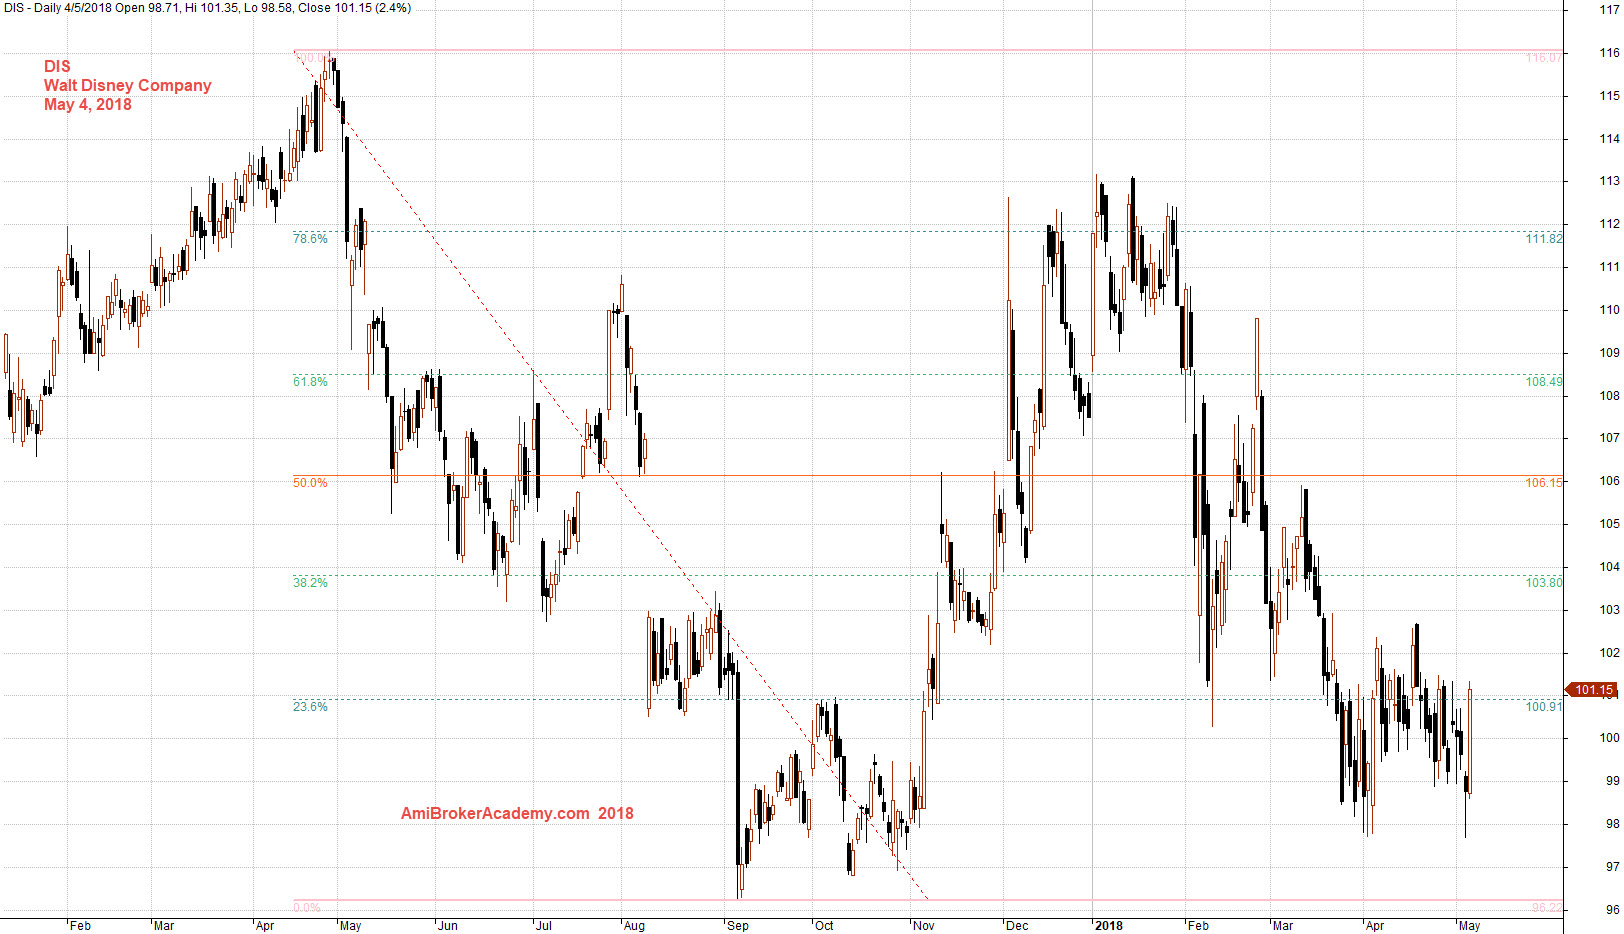
May 4, 2018 Walt Disney Company and Fibo
Moses Stock Analysis
AmiBrokerAcademy.com
Disclaimer: All information, data and material contained, presented, or provided on amibrokeracademy.com is for educational purposes only. It is not to be construed or intended as providing trading or legal advice. Decisions you make about your trading or investment are important to you and your family, therefore should be made in consultation with a competent financial advisor or professional. We are not financial advisor and do not claim to be. Any views expressed here-in are not necessarily those held by amibrokeracademy.com. You are responsible for your trade decision and wealth being.