May 8, 2018
Thanks for visiting the site, AmiBrokerAcademy.com.
In the case of technical analysis. Let study the chart step by step, using Alibaba as example.
US Stock Analysis – Stock Stories
BABA Alibaba Group Holding Charting
Study Alibaba Group Holding of the enclose chart below. It is quite difficult, let add a few things on the chart to understand the buy sell strategy. Another way is to zoom out to find story to help to understand the trade strategy. See another post for more.
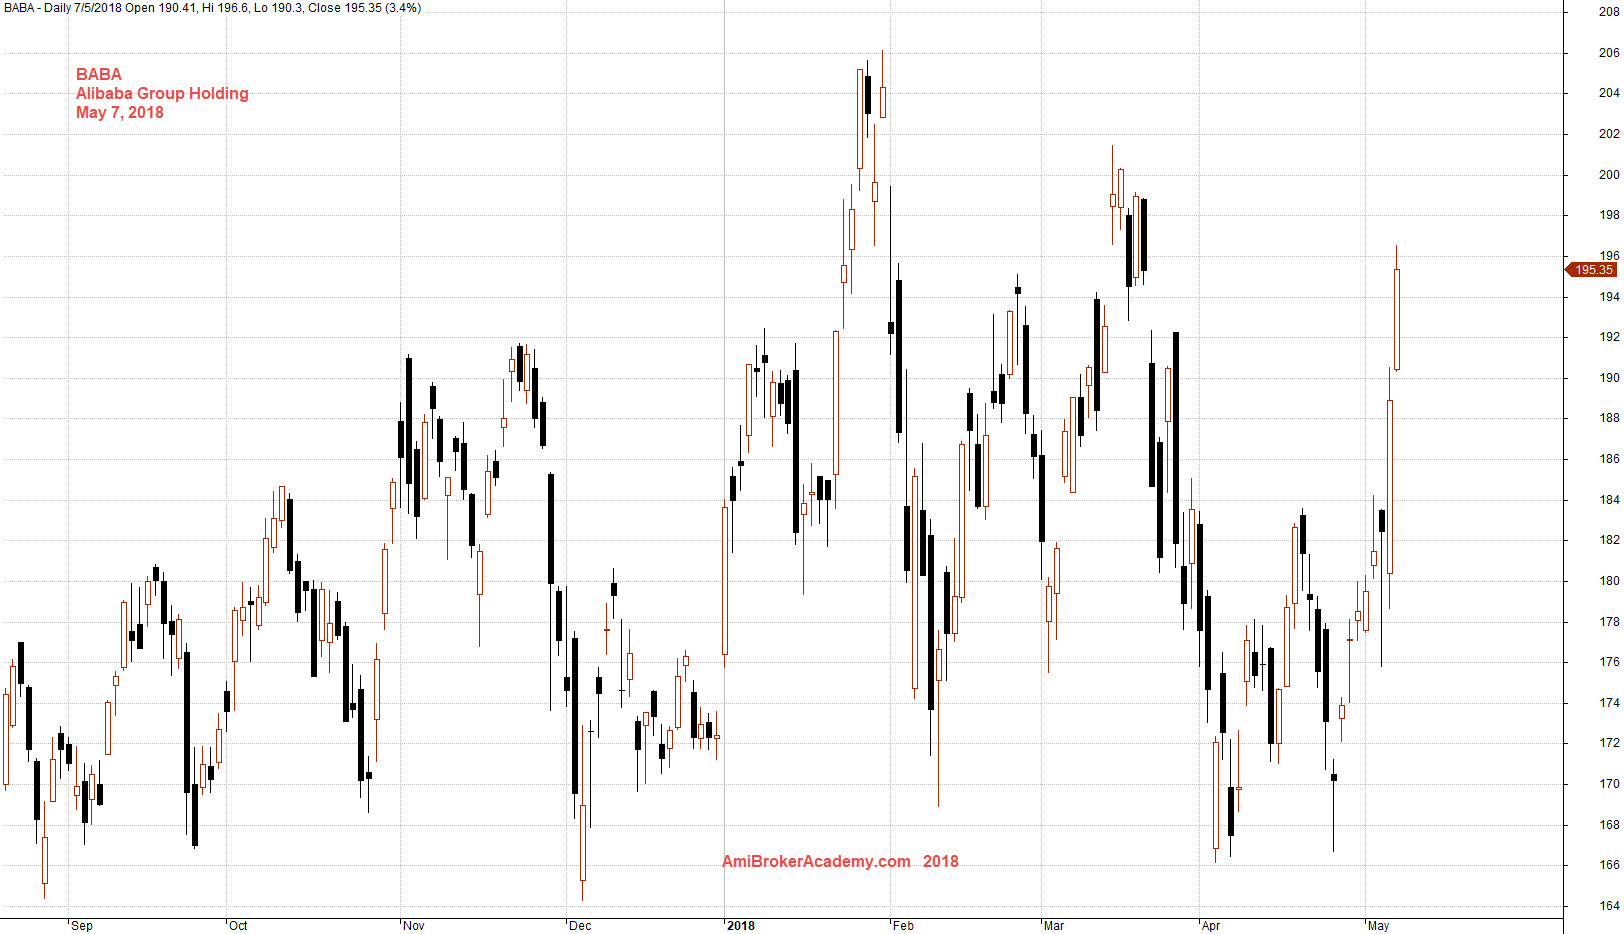
May 7, 2018 Alibaba Group Holding Charting
MACD Indicator
Add MACD indicator, see chart for more. From the MACD signals, plan your trade. Buy or sell. Manage your trade.
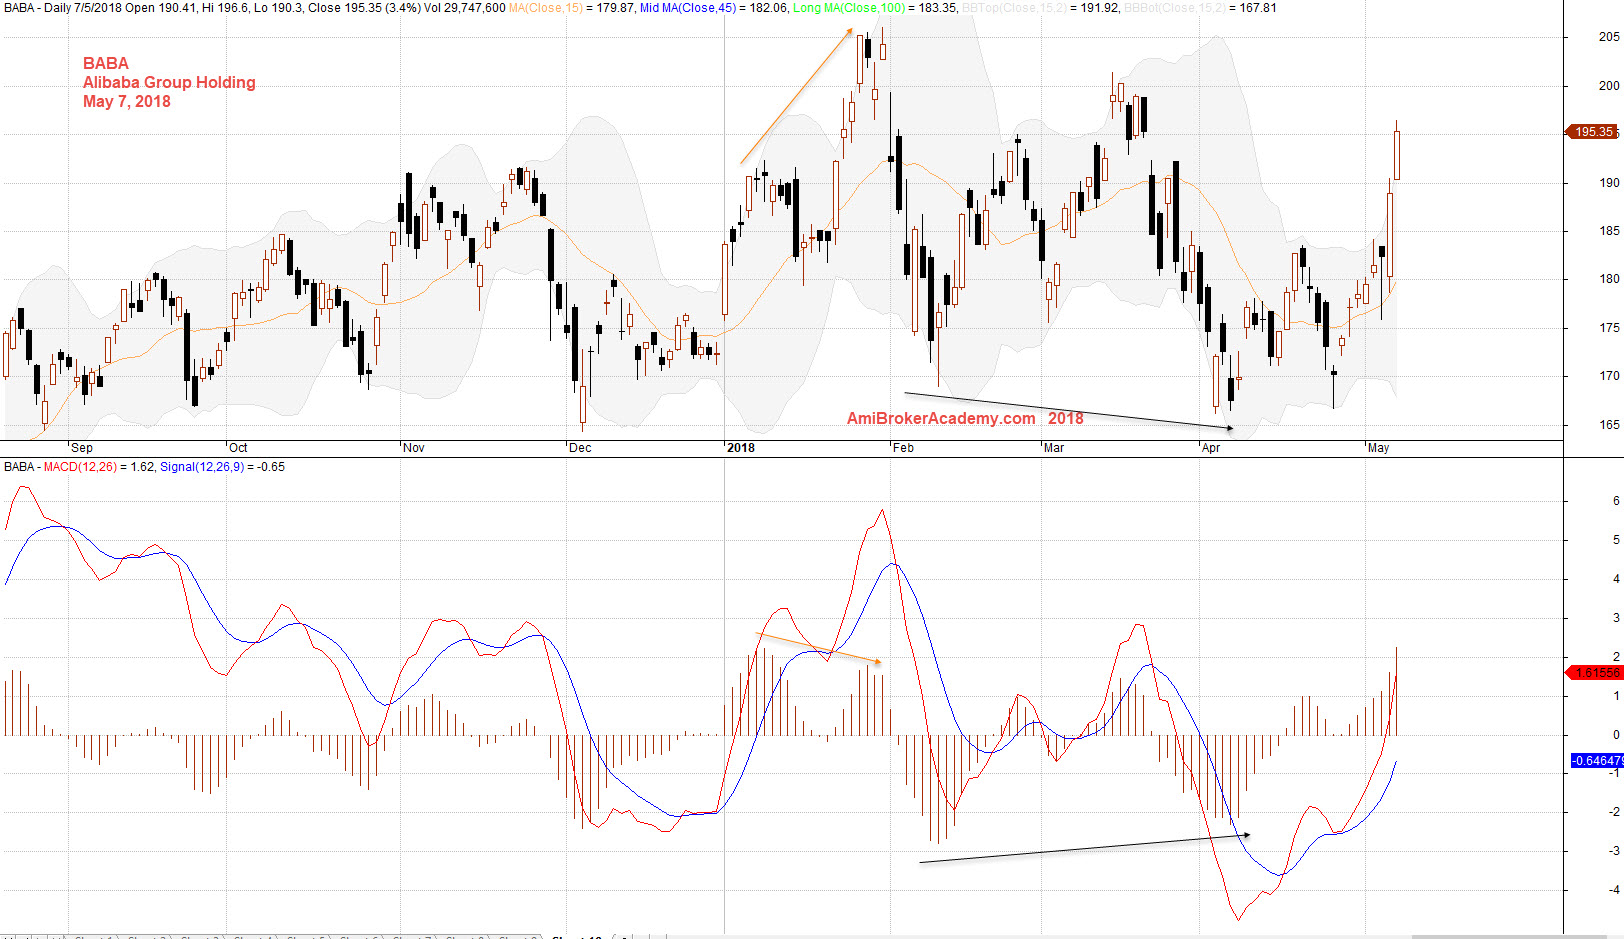
20180507 Alibaba Group Holding and MACD Divergence
MA Wave
Add Moving Average, use a set of three, high low and close MA. See chart for more. Have fun!
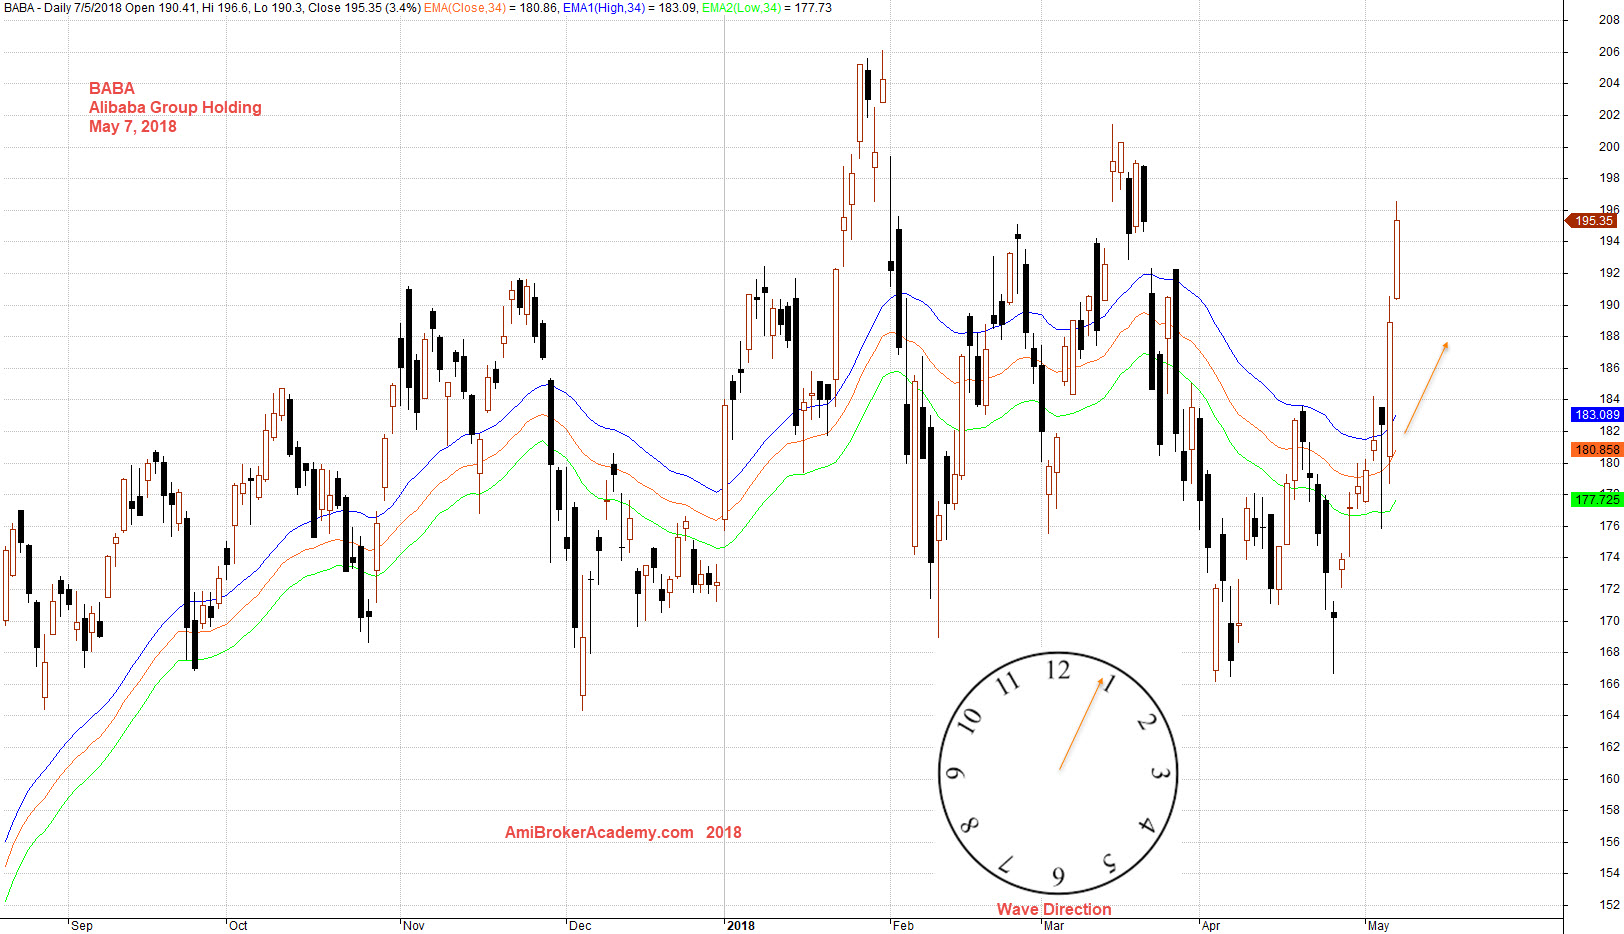
May 7, 2018 Alibaba Group Holding and MA Wave
Moses Stock Analysis
AmiBrokerAcademy.com
Disclaimer: All information, data and material contained, presented, or provided on amibrokeracademy.com is for educational purposes only. It is not to be construed or intended as providing trading or legal advice. Decisions you make about your trading or investment are important to you and your family, therefore should be made in consultation with a competent financial advisor or professional. We are not financial advisor and do not claim to be. Any views expressed here-in are not necessarily those held by amibrokeracademy.com. You are responsible for your trade decision and wealth being.