May 8, 2018
Thanks for visiting the site, AmiBrokerAcademy.com.
US Stock Analysis – Chart Stories
DNB Dun & Bradstreet Corporation and H M Gartley ABCD
Study Dun & Bradstreet Corporation stock price and H M Gartley strategy. See the ABCD pattern, manage your risk.
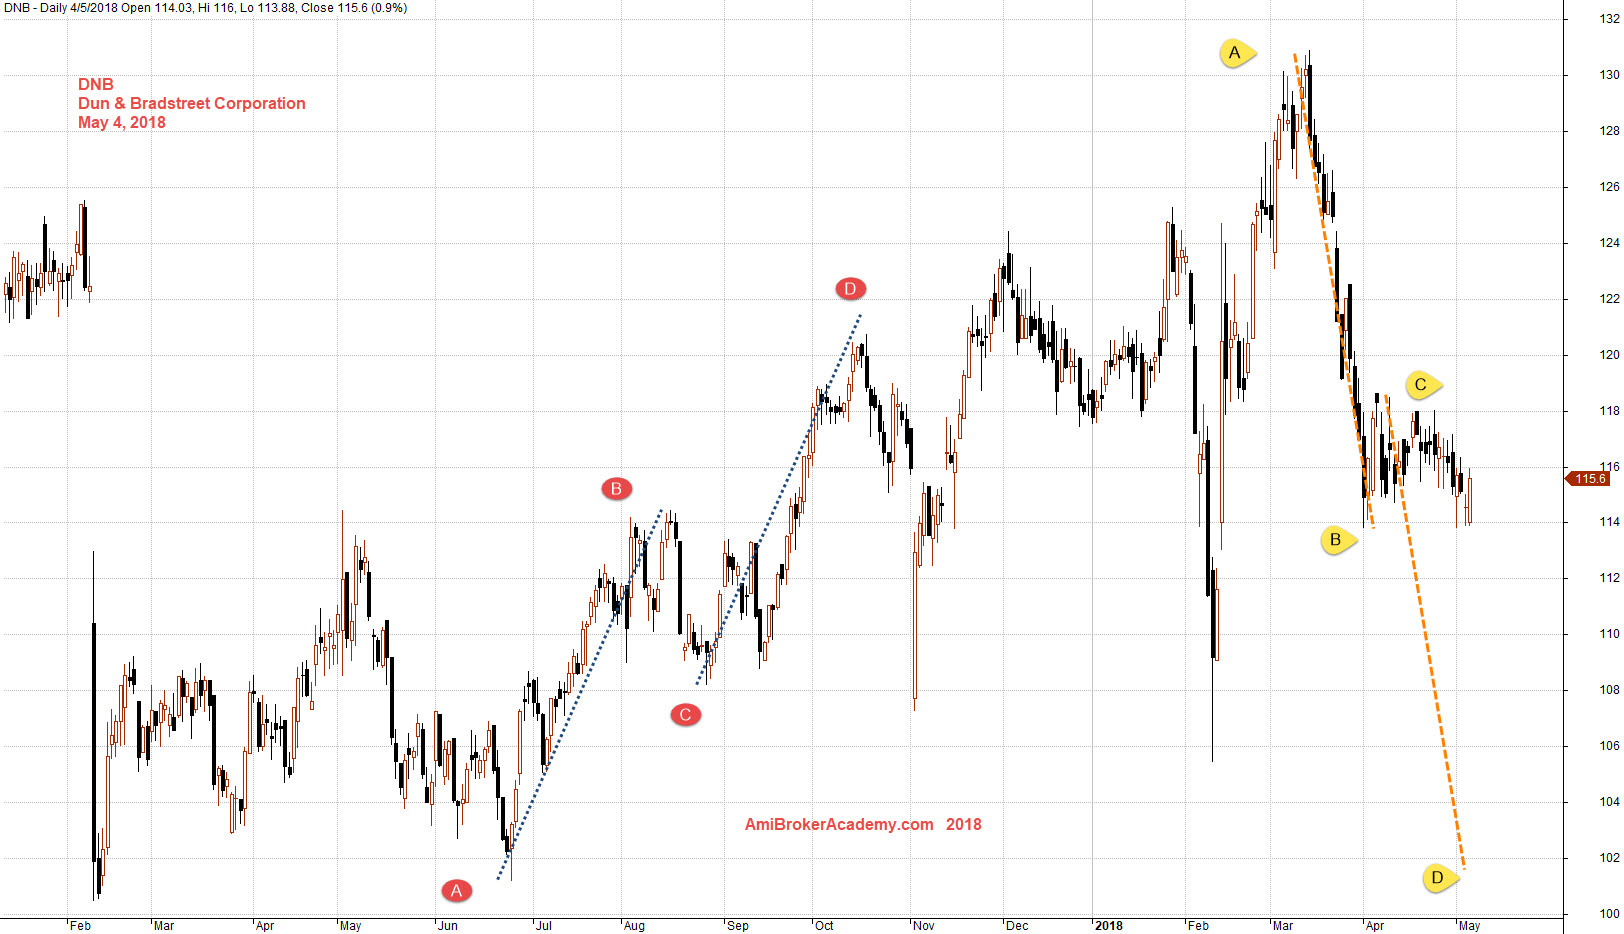
May 4, 2018 Dun & Bradstreet Corporation and ABCD
DNB Dun & Bradstreet Corporation and Fibonacci Extension
Study Dun & Bradstreet Corporation stock price using Fibonacci, swing low to high draw Fibonacci Extension. See chart for more. The stoc kprice after tested at 150% level, the stock price begin the turn down. Now the stock retest the 38% level. Manage your risk.
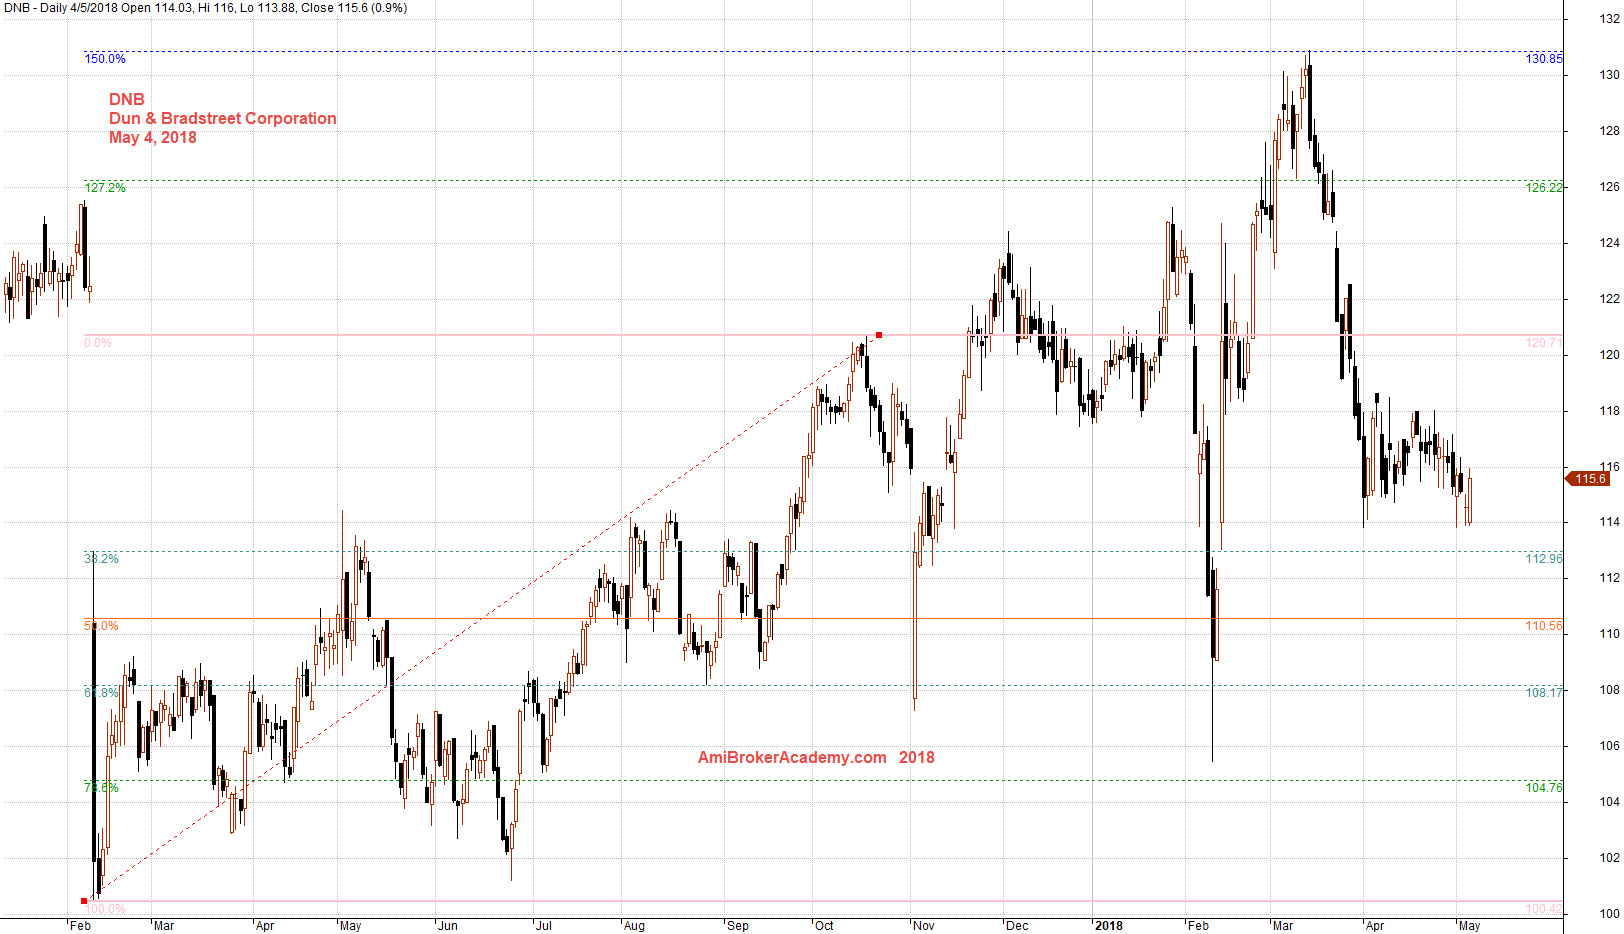
May 4, 2018 Dun & Bradstreet Corporation and Fibo
DNB Dun & Bradstreet Corporation and MA Wave
Study Dun & Bradstreet Corporation stock price using Moving Average. Use a set of high, low and close MAs. We call the three MAs as wave, river, or band. Picture worth a thousand words. Manage your risk.
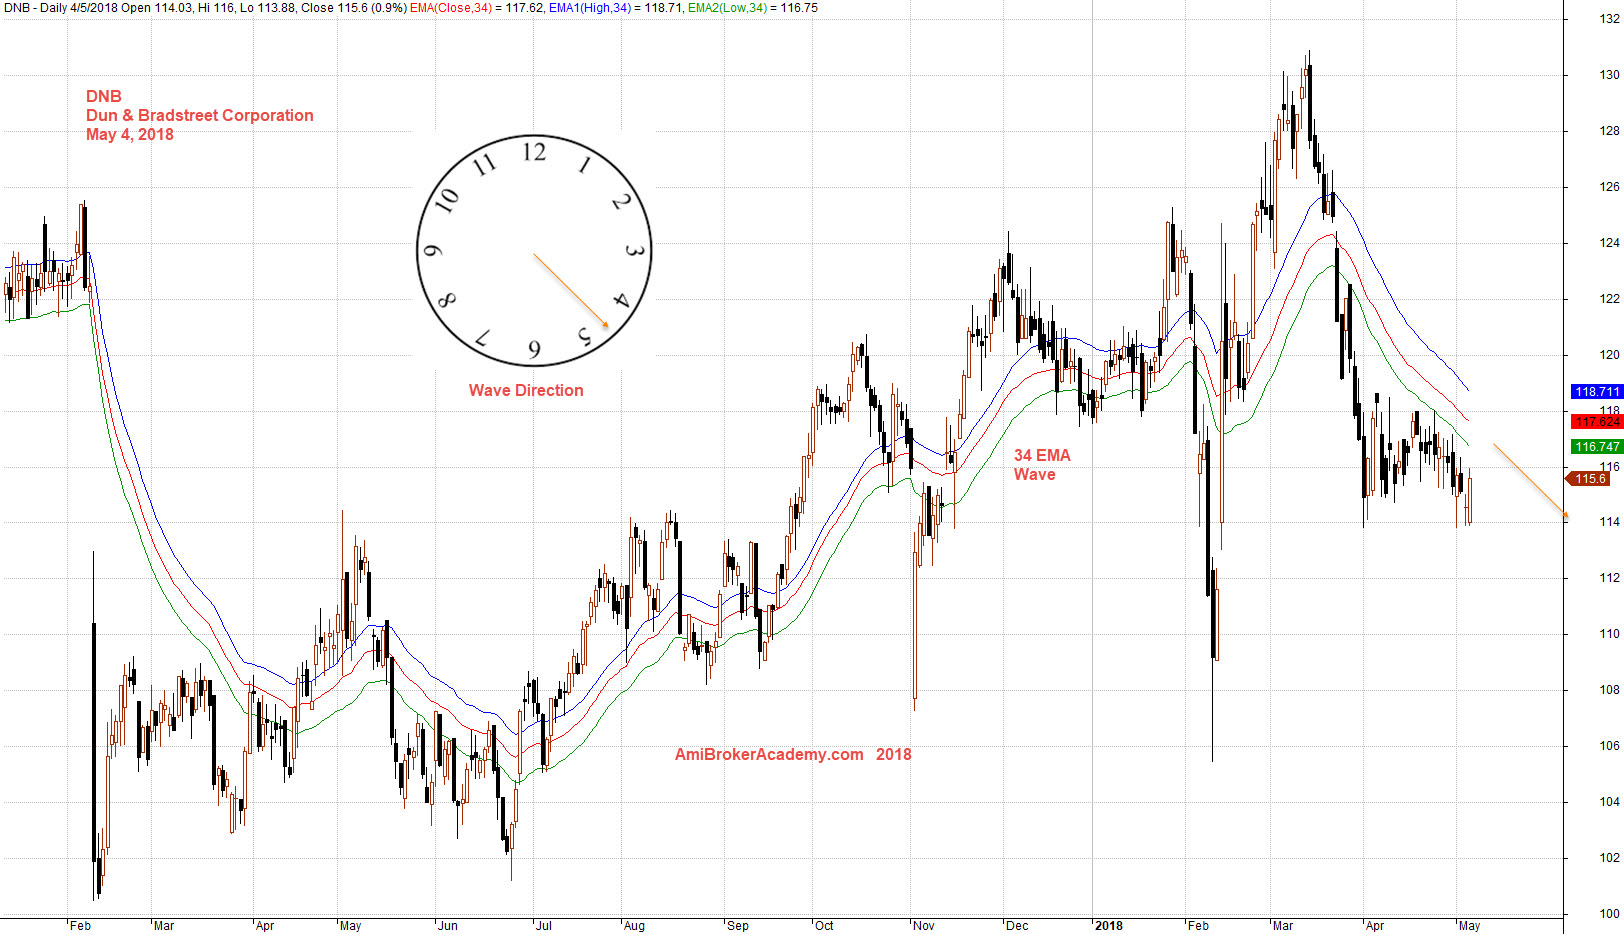
May 4, 2018 Dun & Bradstreet Corporation and MA Wave
Moses Stock Analysis
AmiBrokerAcademy.com
Disclaimer: All information, data and material contained, presented, or provided on amibrokeracademy.com is for educational purposes only. It is not to be construed or intended as providing trading or legal advice. Decisions you make about your trading or investment are important to you and your family, therefore should be made in consultation with a competent financial advisor or professional. We are not financial advisor and do not claim to be. Any views expressed here-in are not necessarily those held by amibrokeracademy.com. You are responsible for your trade decision and wealth being.