May 8, 2018
Thanks for visiting the site, AmiBrokerAcademy.com.
In the case of technical analysis. Let study the chart step by step, see our last posting using Alibaba as example.
US Stock Analysis – Stock Stories
BABA Alibaba Group Holding Charting
In our last posting, if you can not figure out what to trade. It is normal. Even after add the indicator of MACD or Moving Average you still not sure. May be you should step back, in other words, zoom out.
See chart below, we see the stock price move from low to high, bullish trend. Thereafter, the price action start to move sideways. See chart. You probably can draw a support line. With that you can form a buy support sell resistance strategy.
Picture worth a thousand words, see chart for more.
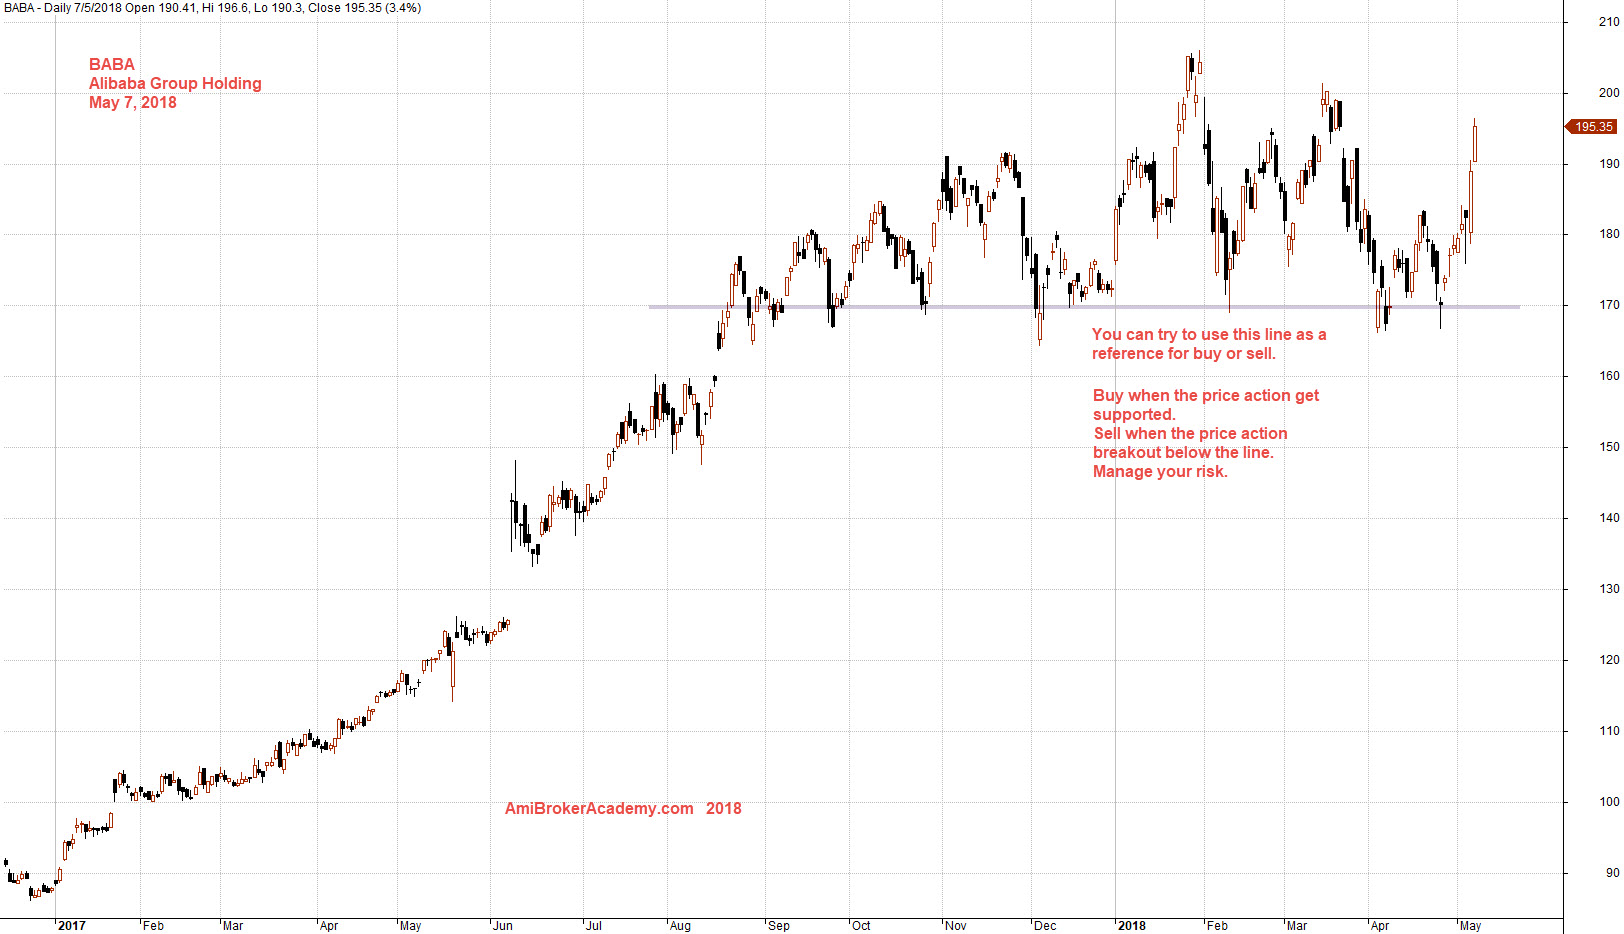
May 7, 2018 Alibaba Group Holding Charting and Buy Sell Strategy
Moses Stock Analysis
AmiBrokerAcademy.com
Disclaimer: All information, data and material contained, presented, or provided on amibrokeracademy.com is for educational purposes only. It is not to be construed or intended as providing trading or legal advice. Decisions you make about your trading or investment are important to you and your family, therefore should be made in consultation with a competent financial advisor or professional. We are not financial advisor and do not claim to be. Any views expressed here-in are not necessarily those held by amibrokeracademy.com. You are responsible for your trade decision and wealth being.