March 17, 2018
Hong Kong Stock Chart Analysis
0992.HK Lenovo Group 联想集团 Charting and ABCD Pattern
Study chart, using ABCD pattern, you can spot many ABCD patterns.
Manage your risk!
Powerful Chart Software – AmiBroker
The following chart is produced using AmiBroker charting software. It is a powerful chart software. Anything, finance ticket you could download from Yahoo! Finance you could plot them, those you are interested all in a chart, so you could analyse them. See chart below like the popular Bitcoin.
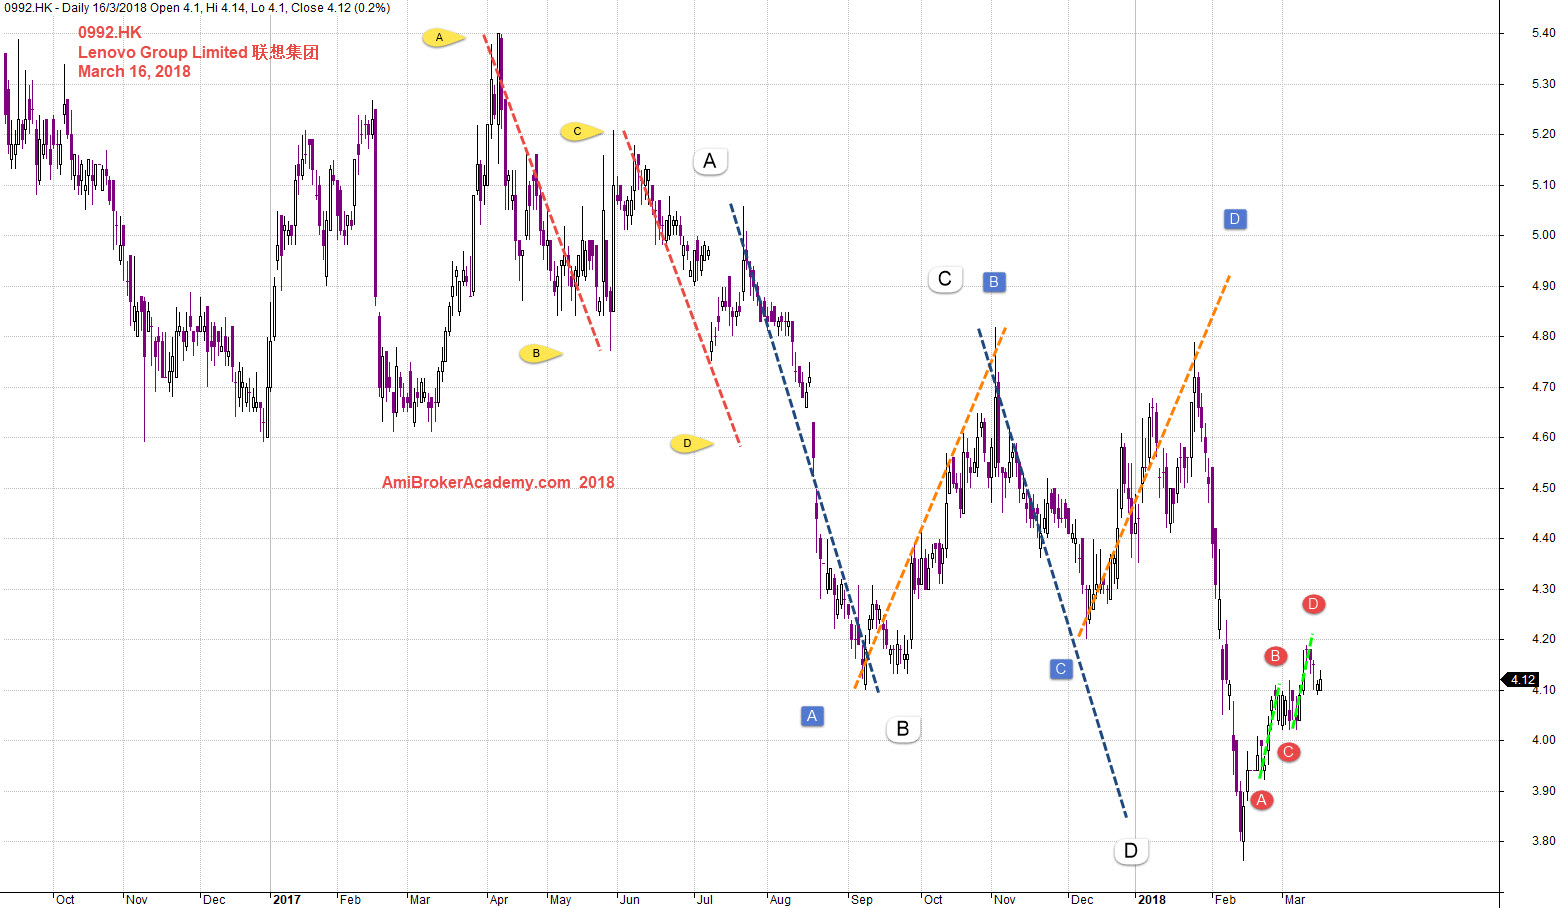
March 16, 2018 Lenovo Group 联想集团 and ABCD
Lenovo Group Limited 联想集团 and MACD
Study chart, using MACD. Price action and MACD move in the similar step. From MACD indicator MACD cross up zeroline, but the stock price may not able to be retest the same high. If you understand you know what I mean, but at least the bull will take over as the MACD has also cross up signal.
Manage your risk!
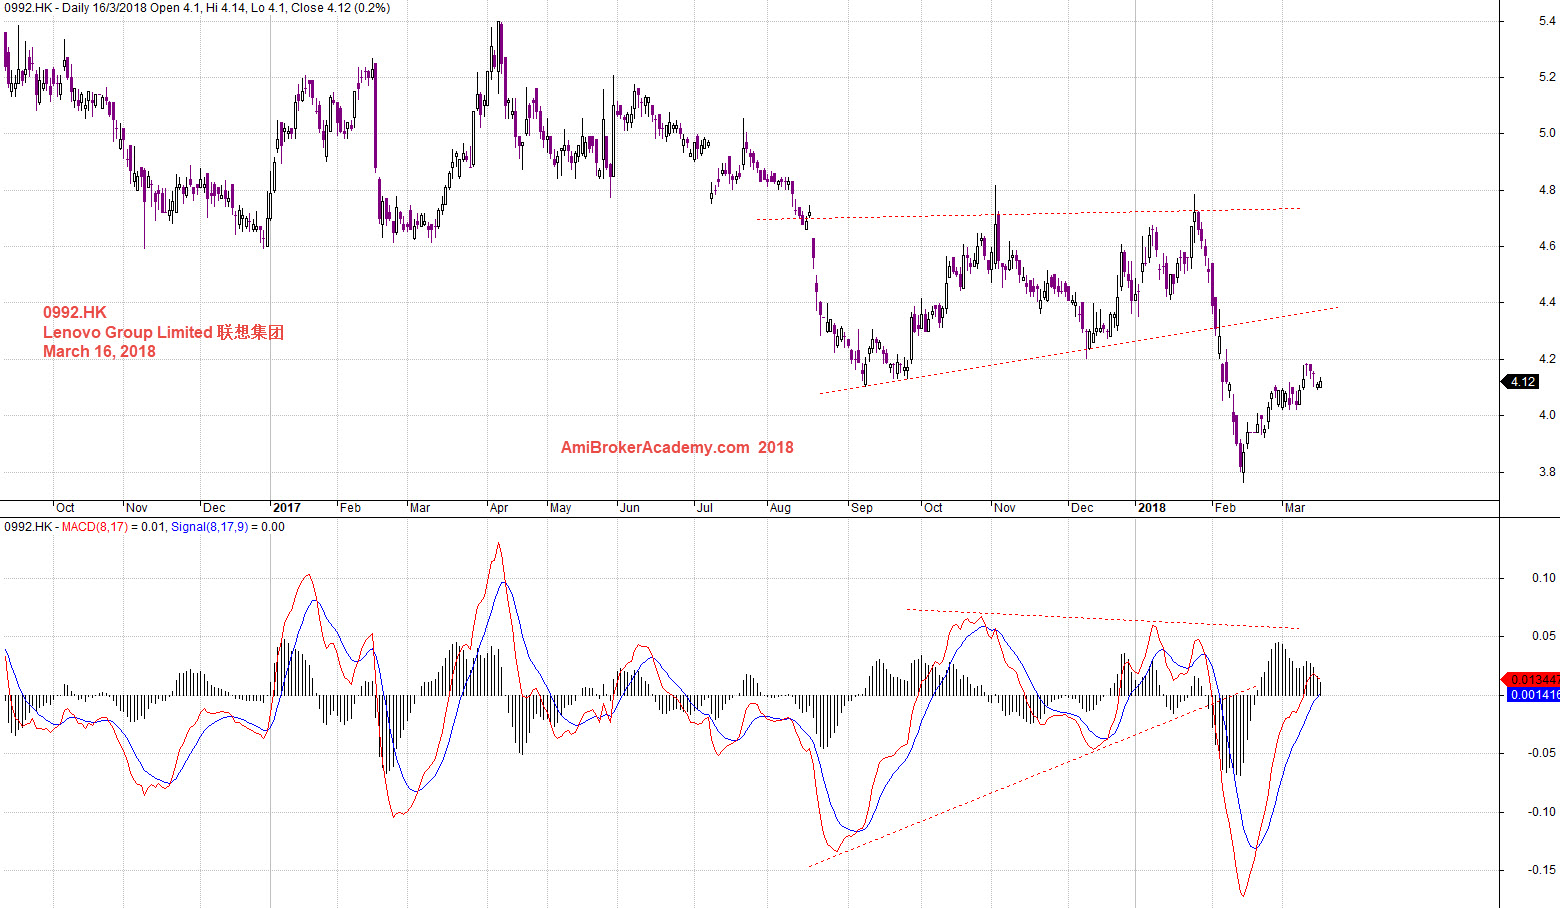
March 16, 2018 Lenovo Group Limited 联想集团 and MACD
Lenovo Group Limited 联想集团 Charting and Fibonacci
Study chart using Fibonacci to project where the price might test, see the swing high to low. We see the Fibonacci Extension retest 50% level again, the price action drop down to test the 127%. Manage your risk.
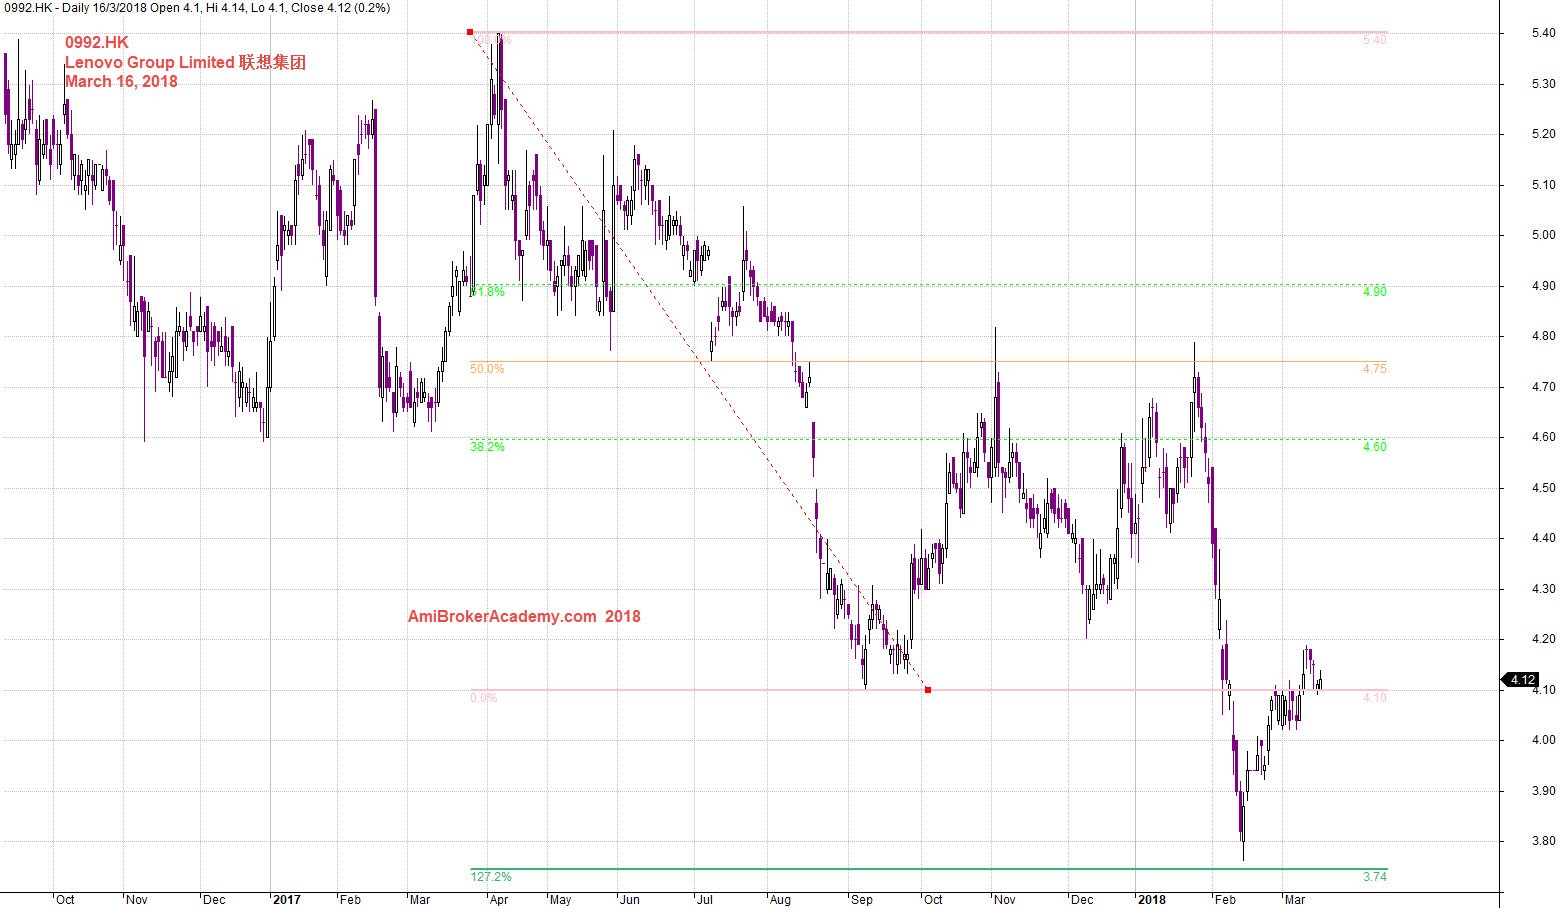
March 16, 2018 Lenovo Group Limited 联想集团 and Fib Extension High to Low
Moses China Stock Chart Analysis
AmiBrokerAcademy.com
Disclaimer
The above result is for illustration purpose. It is not meant to be used for buy or sell decision. We do not recommend any particular stocks. If particular stocks of such are mentioned, they are meant as demonstration of Amibroker as a powerful charting software and MACD. Amibroker can program to scan the stocks for buy and sell signals.
These are script generated signals. Not all scan results are shown here. The MACD signal should use with price action. Users must understand what MACD and price action are all about before using them. If necessary you should attend a course to learn more on Technical Analysis (TA) and Moving Average Convergence Divergence, MACD.
Once again, the website does not guarantee any results or investment return based on the information and instruction you have read here. It should be used as learning aids only and if you decide to trade real money, all trading decision should be your own.