March 16, 2018
Oscillator Moving Average Convergence Divergence
MACD is a popular trend following momentum indicator that shows the relationship of two moving averages of prices action; the MACD line and signal line.
Four MACD Signals:
- Crossovers – Sell Strategy, MACD crosses below the signal line. Buy Strategy, MACD rallies above the signal line. It is advisable to wait for confirmation to reduce possible whipsaw.
- Divergence – The security price action diverges from the MACD. It signals the end of the current trend.
- Cross Zero Line – MACD moves above or below zero line. Upward trend: Cross above zero line, short MA above long MA. Downward trend: Cross below zero line, short MA below long MA.
- Dramatic rise or fall – MACD rises or decline dramatically – when the shorter moving average pulls away from the longer-term moving average – Oversold or Overbought.
Free One-day US Stock MACD Screening Results for 14 March 2018
Remember all setup can fail. This is true for all indicators. It is also true for MACD signals setup. See some of the MACD setup fail examples on this website.
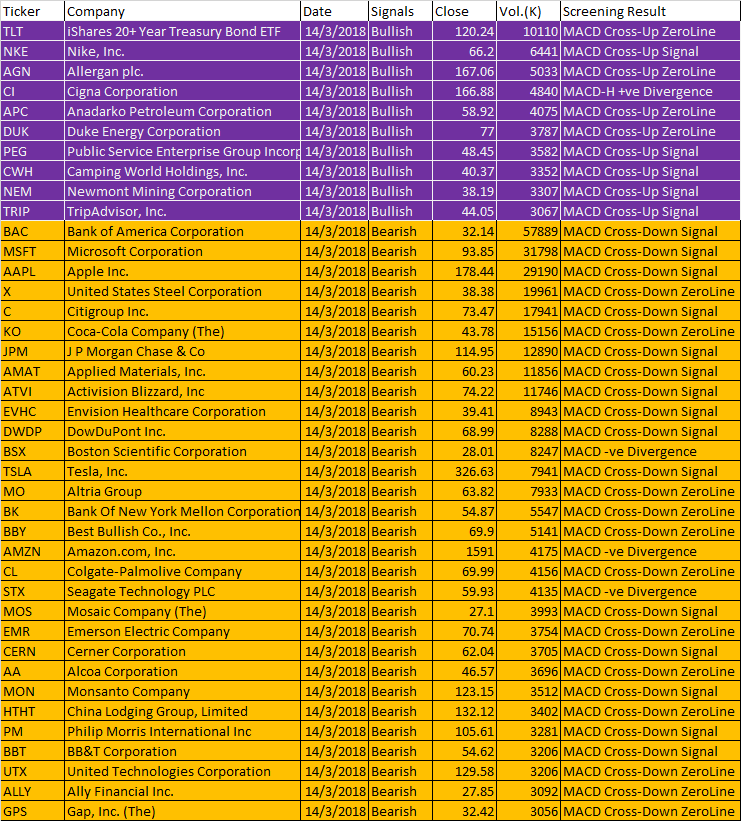
March 14, 2018 US Stock One-day MACD Signals
- MACD line crosses above MACD signal – Bullish trend
- MACD line crosses above zero line – Bullish trend
- MACD Histogram +ve Divergence – Bullish trend
- MACD line crosses below MACD signal – Bearish trend
- MACD line crosses below zero line – Bearish trend
- MACD Histogram -ve Divergence – Bearish trend
| Ticker | Company | Date | Signals | Close | Vol.(K) | Screening Result |
| TLT | iShares 20+ Year Treasury Bond ETF | 14/3/2018 | Bullish | 120.24 | 10110 | MACD Cross-Up ZeroLine |
| NKE | Nike, Inc. | 14/3/2018 | Bullish | 66.2 | 6441 | MACD Cross-Up Signal |
| AGN | Allergan plc. | 14/3/2018 | Bullish | 167.06 | 5033 | MACD Cross-Up ZeroLine |
| CI | Cigna Corporation | 14/3/2018 | Bullish | 166.88 | 4840 | MACD-H +ve Divergence |
| APC | Anadarko Petroleum Corporation | 14/3/2018 | Bullish | 58.92 | 4075 | MACD Cross-Up ZeroLine |
| DUK | Duke Energy Corporation | 14/3/2018 | Bullish | 77 | 3787 | MACD Cross-Up ZeroLine |
| PEG | Public Service Enterprise Group Incorporated | 14/3/2018 | Bullish | 48.45 | 3582 | MACD Cross-Up Signal |
| CWH | Camping World Holdings, Inc. | 14/3/2018 | Bullish | 40.37 | 3352 | MACD Cross-Up Signal |
| NEM | Newmont Mining Corporation | 14/3/2018 | Bullish | 38.19 | 3307 | MACD Cross-Up Signal |
| TRIP | TripAdvisor, Inc. | 14/3/2018 | Bullish | 44.05 | 3067 | MACD Cross-Up Signal |
| BAC | Bank of America Corporation | 14/3/2018 | Bearish | 32.14 | 57889 | MACD Cross-Down Signal |
| MSFT | Microsoft Corporation | 14/3/2018 | Bearish | 93.85 | 31798 | MACD Cross-Down Signal |
| AAPL | Apple Inc. | 14/3/2018 | Bearish | 178.44 | 29190 | MACD Cross-Down Signal |
| X | United States Steel Corporation | 14/3/2018 | Bearish | 38.38 | 19961 | MACD Cross-Down ZeroLine |
| C | Citigroup Inc. | 14/3/2018 | Bearish | 73.47 | 17941 | MACD Cross-Down Signal |
| KO | Coca-Cola Company (The) | 14/3/2018 | Bearish | 43.78 | 15156 | MACD Cross-Down ZeroLine |
| JPM | J P Morgan Chase & Co | 14/3/2018 | Bearish | 114.95 | 12890 | MACD Cross-Down Signal |
| AMAT | Applied Materials, Inc. | 14/3/2018 | Bearish | 60.23 | 11856 | MACD Cross-Down Signal |
| ATVI | Activision Blizzard, Inc | 14/3/2018 | Bearish | 74.22 | 11746 | MACD Cross-Down Signal |
| EVHC | Envision Healthcare Corporation | 14/3/2018 | Bearish | 39.41 | 8943 | MACD Cross-Down Signal |
| DWDP | DowDuPont Inc. | 14/3/2018 | Bearish | 68.99 | 8288 | MACD Cross-Down Signal |
| BSX | Boston Scientific Corporation | 14/3/2018 | Bearish | 28.01 | 8247 | MACD -ve Divergence |
| TSLA | Tesla, Inc. | 14/3/2018 | Bearish | 326.63 | 7941 | MACD Cross-Down Signal |
| MO | Altria Group | 14/3/2018 | Bearish | 63.82 | 7933 | MACD Cross-Down ZeroLine |
| BK | Bank Of New York Mellon Corporation (The) | 14/3/2018 | Bearish | 54.87 | 5547 | MACD Cross-Down ZeroLine |
| BBY | Best Bullish Co., Inc. | 14/3/2018 | Bearish | 69.9 | 5141 | MACD Cross-Down ZeroLine |
| AMZN | Amazon.com, Inc. | 14/3/2018 | Bearish | 1591 | 4175 | MACD -ve Divergence |
| CL | Colgate-Palmolive Company | 14/3/2018 | Bearish | 69.99 | 4156 | MACD Cross-Down ZeroLine |
| STX | Seagate Technology PLC | 14/3/2018 | Bearish | 59.93 | 4135 | MACD -ve Divergence |
| MOS | Mosaic Company (The) | 14/3/2018 | Bearish | 27.1 | 3993 | MACD Cross-Down Signal |
| EMR | Emerson Electric Company | 14/3/2018 | Bearish | 70.74 | 3754 | MACD Cross-Down ZeroLine |
| CERN | Cerner Corporation | 14/3/2018 | Bearish | 62.04 | 3705 | MACD Cross-Down Signal |
| AA | Alcoa Corporation | 14/3/2018 | Bearish | 46.57 | 3696 | MACD Cross-Down ZeroLine |
| MON | Monsanto Company | 14/3/2018 | Bearish | 123.15 | 3512 | MACD Cross-Down Signal |
| HTHT | China Lodging Group, Limited | 14/3/2018 | Bearish | 132.12 | 3402 | MACD Cross-Down ZeroLine |
| PM | Philip Morris International Inc | 14/3/2018 | Bearish | 105.61 | 3281 | MACD Cross-Down Signal |
| BBT | BB&T Corporation | 14/3/2018 | Bearish | 54.62 | 3206 | MACD Cross-Down Signal |
| UTX | United Technologies Corporation | 14/3/2018 | Bearish | 129.58 | 3206 | MACD Cross-Down ZeroLine |
| ALLY | Ally Financial Inc. | 14/3/2018 | Bearish | 27.85 | 3092 | MACD Cross-Down ZeroLine |
| GPS | Gap, Inc. (The) | 14/3/2018 | Bearish | 32.42 | 3056 | MACD Cross-Down ZeroLine |
Have fun!Users must understand what MACD is all about before using the results.
Moses US Stock Scan
AmiBroker Academy.com
Disclaimer:
The above result is for illustration purpose. It is not meant to be used for buy or sell decision. We do not recommend any particular stocks. If particular stocks of such are mentioned, they are meant as demonstration of Amibroker as a powerful charting software and MACD. Amibroker can program to scan the stocks for buy and sell signals.
These are script generated signals. Not all scan results are shown here. The MACD signal should use with price action. Users must understand what MACD and price action are all about before using them. If necessary you should attend a course to learn more on Technical Analysis (TA) and Moving Average Convergence Divergence, MACD.
Once again, the website does not guarantee any results or investment return based on the information and instruction you have read here. It should be used as learning aids only and if you decide to trade real money, all trading decision should be your own.