22 July 2021
Welcome!
Welcome to AmiBroker Academy dot com, amibrokeracademy.com.
Trading is all about observation, reading the price bar but not listen to news. By the time you hear the news it is already old and become history. Why? It is very simple, remember where the news come from? It has first someone release to the news agency like CNBC, and so on. Next, someone has to read the news to you after some research and summarize. This will be few hours later, by then the price action has already done.
As for price bar, it is what the market supply and remand. When market feel that is over price, the price will drop. All this reflected on the price bar almost instantly.
Next is how to read our price bar plus using some tools, such as MACD.
Here, we simply translate price action chart into layman language. This will help you in understand the financial instrument you are trading. We believe picture worth a thousand words. So, sometimes we use less words. You can learn the price action interpretation too. Give it a tray. You may not have the same view points as us. Remember all analysis read price action chart differently. It is just like reading an essay, we will have different conclusion.
Trade well.
Trade what you see. Manage your risk.
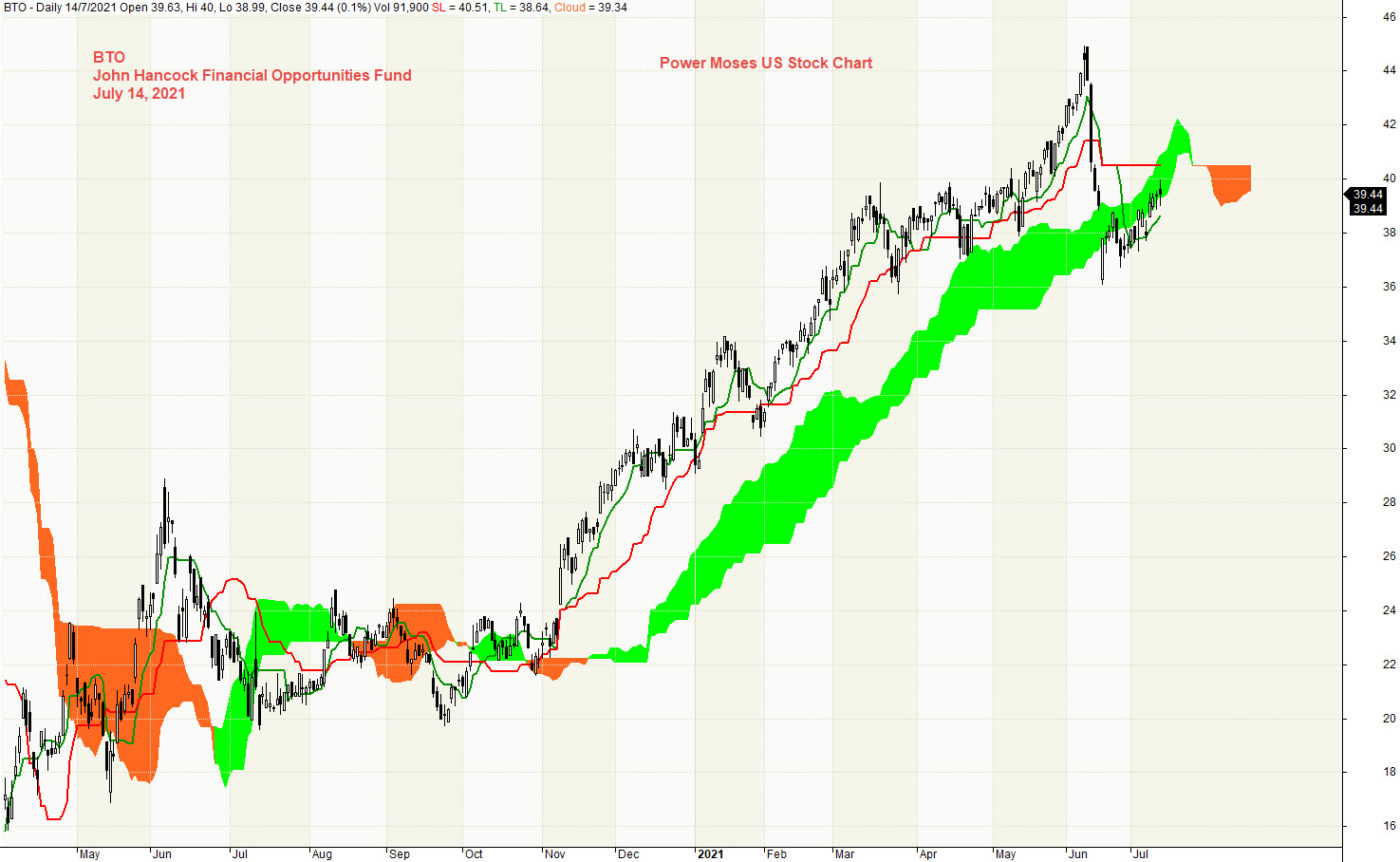
1) BTO | John Hancock Financial Opportunities Fund and Ichimoku Cloud
Ichimoku Cloud is a trend following strategy tool, can use in any market and any timeframe. Ichimoku indicator emphasize to trade in the trend direction. We see price action emerge from the cloud and stay above. Bull trend. Price Action goes on bottom of cloud and close above and eventually stay above. But, but the price action has become weaker and pullback into cloud. One thing in trading, if you are not sure, stand aside and watch. Price Action now is possible to sink into and go below cloud. We see Tenkan Sen (green) after zigzag with Kijun Sen (red) and finally stay above. But this ended in July, Tenkan start to cross below Kijun and stay below, bear trend is about to start. Will see. Trade what you see.
Ichimoku is a great visual tool too, to help in avoid trading in the wrong direction.
Ichimoku Cloud is a multi-dimensional indicator designed to offer support and resistance levels, trending, and entry and exit points. Besides that, Ichimoku is an indicator that gauges future price momentum and determine futures areas of support and resistance. Price Action is currently below cloud.
Remember, we just read what the chart said. We do not and can not personalize the price action to your liking. Have fun!
Don’t play play with Ichimoku indicator. Very simple. Yet powerful. AmiBrokerAcademy provides you simple yet powerful stock chart. Check out Moses power stock chart.
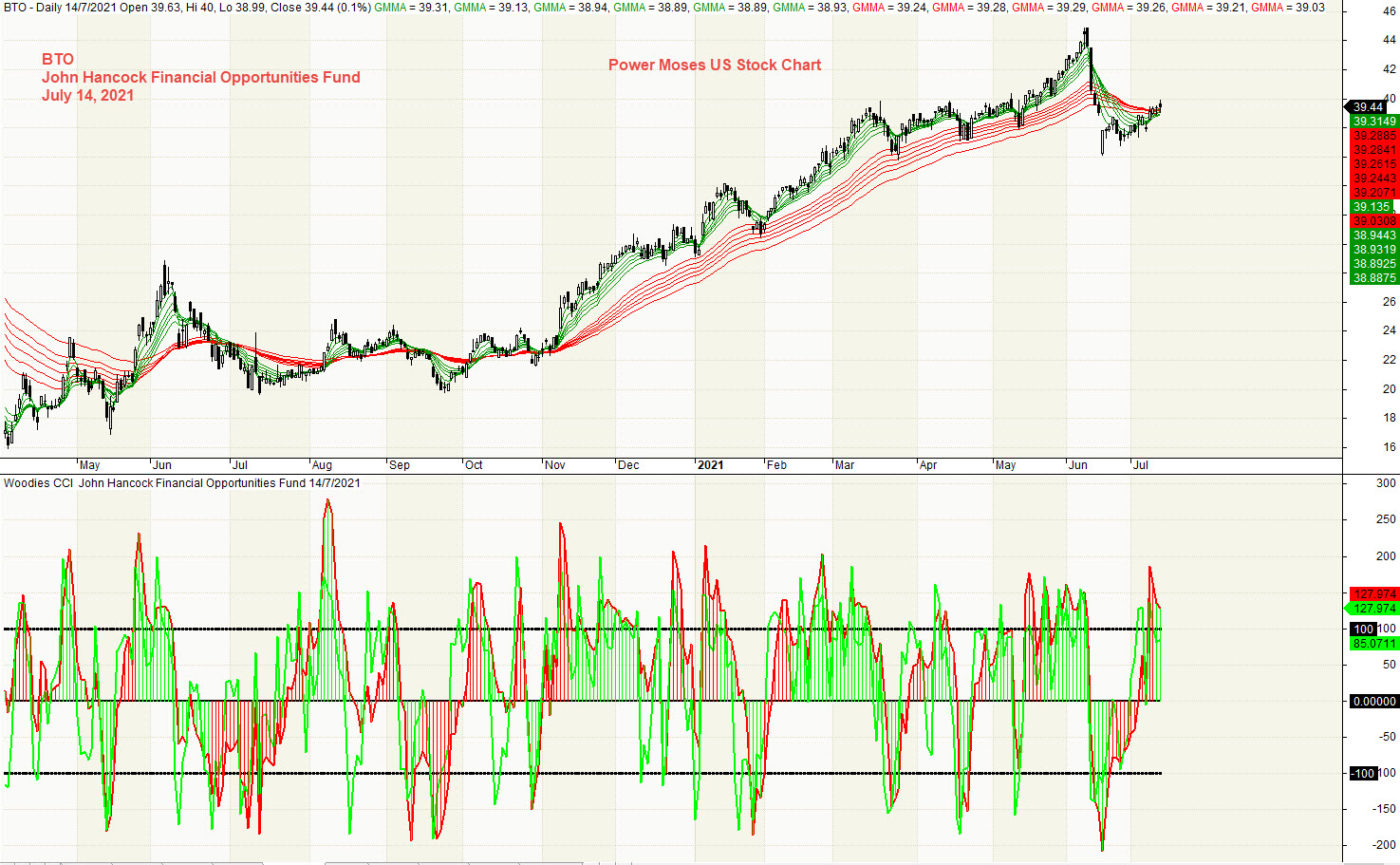
2) John Hancock Financial Opportunities Fund and GMMA and Woodies CCI
As we said in the Ichimoku Cloud analysis, we ask you to stand aside when you are not sure. Study John Hancock Financial Opportunities Fund price action with GMMA and Woodies. Price action goes from low to high and pullback, from bottom left to top right.
It starts from price action and Fast MA (green) from bottom to above Slow MA (red) and stay above. At June, price action pullback, price action close below Fast MA and Fast MA close below Slow MA.
From chart, price action seems to be resisted by Slow MA. Will see, trade what you see.
Mange your risk.
Moses Power Charting
Official AmiBrokerAcademy.com Charting
Disclaimer
The above result is for illustration purpose. It is not meant to be used for buy or sell decision. We do not recommend any particular stocks. If particular stocks of such are mentioned, they are meant as demonstration of Amibroker as a powerful charting software and MACD. Amibroker can program to scan the stocks for buy and sell signals.
These are script generated signals. Not all scan results are shown here. The MACD signal should use with price action. Users must understand what MACD and price action are all about before using them. If necessary you should attend a course to learn more on Technical Analysis (TA) and Moving Average Convergence Divergence, MACD.
Once again, the website does not guarantee any results or investment return based on the information and instruction you have read here. It should be used as learning aids only and if you decide to trade real money, all trading decision should be your own.
We learn from many past and present great traders. Kudo to these master.