22 July 2021
Welcome!
Welcome to AmiBroker Academy dot com, amibrokeracademy.com.
Trading is all about observation, reading the price bar but not listen to news. By the time you hear the news it is already old and become history. Why? It is very simple, remember where the news come from? It has first someone release to the news agency like CNBC, and so on. Next, someone has to read the news to you after some research and summarize. This will be few hours later, by then the price action has already done.
As for price bar, it is what the market supply and remand. When market feel that is over price, the price will drop. All this reflected on the price bar almost instantly.
Next is how to read our price bar plus using some tools, such as MACD.
Here, we simply translate price action chart into layman language. This will help you in understand the financial instrument you are trading. We believe picture worth a thousand words. So, sometimes we use less words. You can learn the price action interpretation too. Give it a tray. You may not have the same view points as us. Remember all analysis read price action chart differently. It is just like reading an essay, we will have different conclusion.
Trade well.
Trade what you see. Manage your risk.
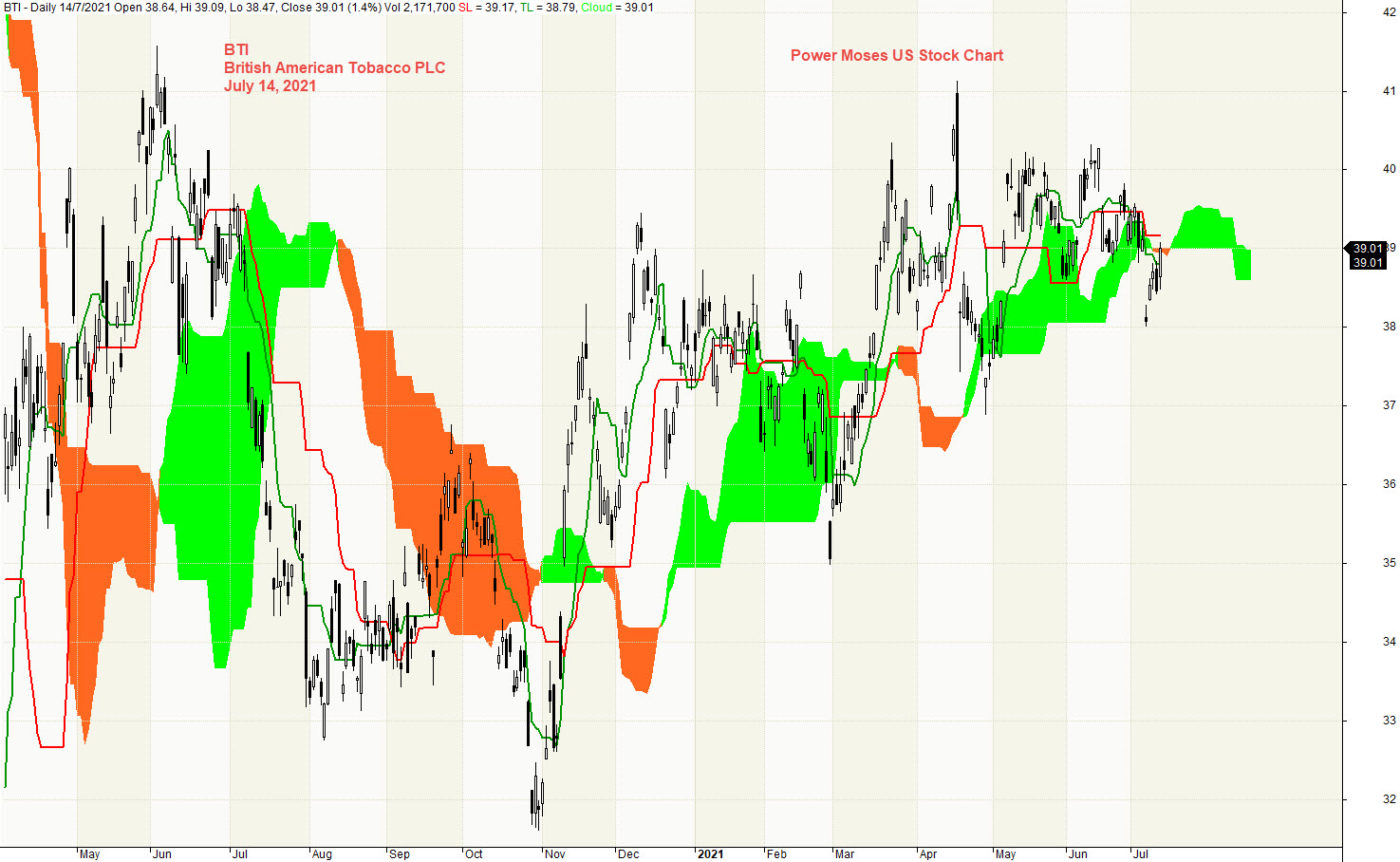
1) BTI | British American Tobacco PLC and Ichimoku Cloud
Ichimoku Cloud is a trend following strategy tool, can use in any market and any timeframe. Ichimoku indicator emphasize to trade in the trend direction. In the following chart, it is very messy, price action in and out of cloud. Sometime bull bias and others bear. If you still insist must use Ichimoku cloud, we suggest you segment the chart into bull or bear portion. And apply your your buy sell strategy. We now leave it to you to interpret the price action chart and Ichimoku cloud. If you have double, read the earlier Ichimoku analysis to get better interpretation. Have fun!
Remember, Ichimoku is a great visual tool too, to help in avoid trading in the wrong direction.
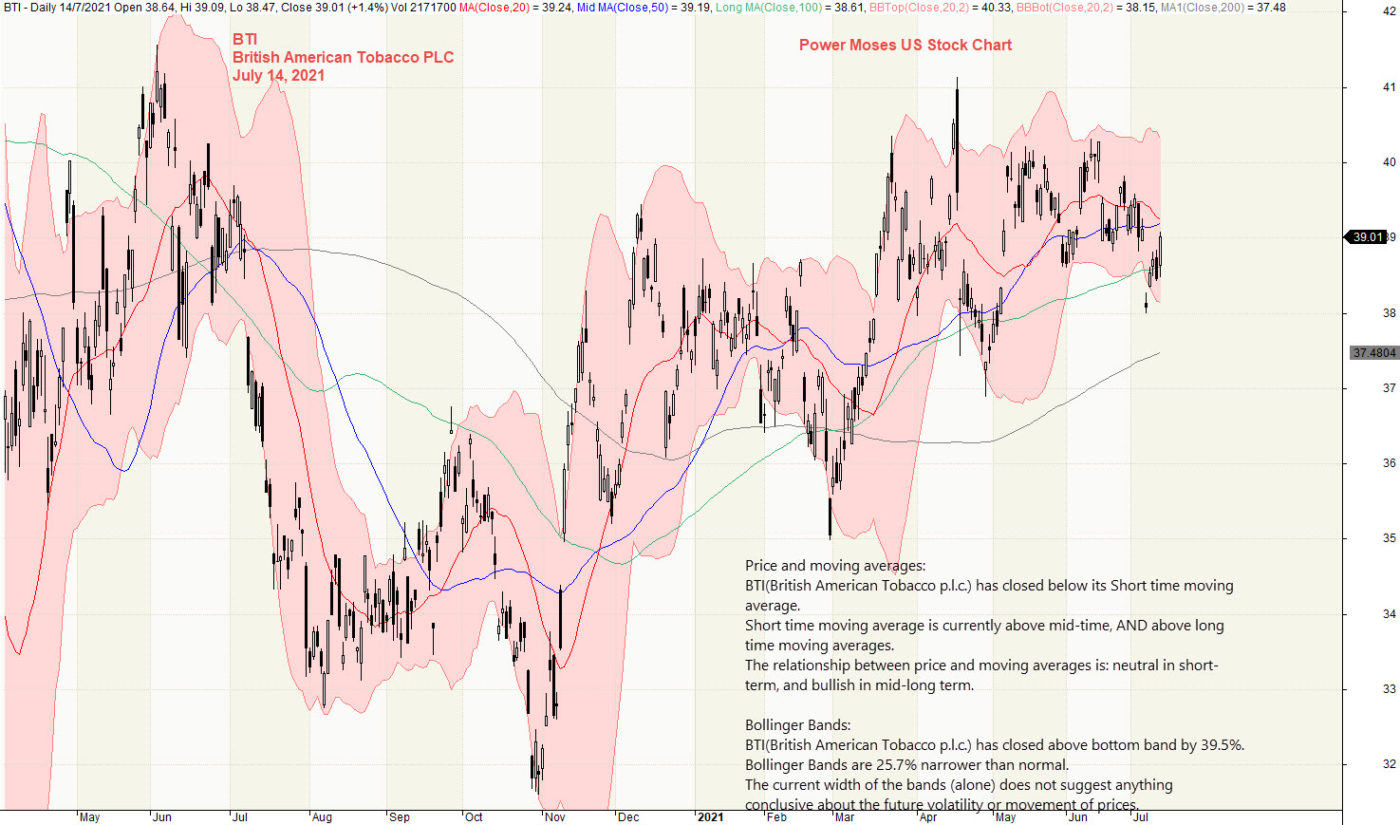
2) British American Tobacco PLC and Bollinger Bands and Moving Averages
Study British American Tobacco PLC price action using Bollinger Bands and Moving Averages. Price action goes from low to high and retest the high.
It is good about Bollinger Bands, the bands always able to envelop the price action, the most is price action going through extreme by keeping it outside the bands. So, what when price action is on upper bands, the price action may pullback and test the bottom band. Likewise, when it is tracing on the bottom banes, the price action may be bounce up to hit the top bands.
From chart, price action seems to be resisted by resistance and moving sideways. True or true? Will see, trade what you see.
Mange your risk.
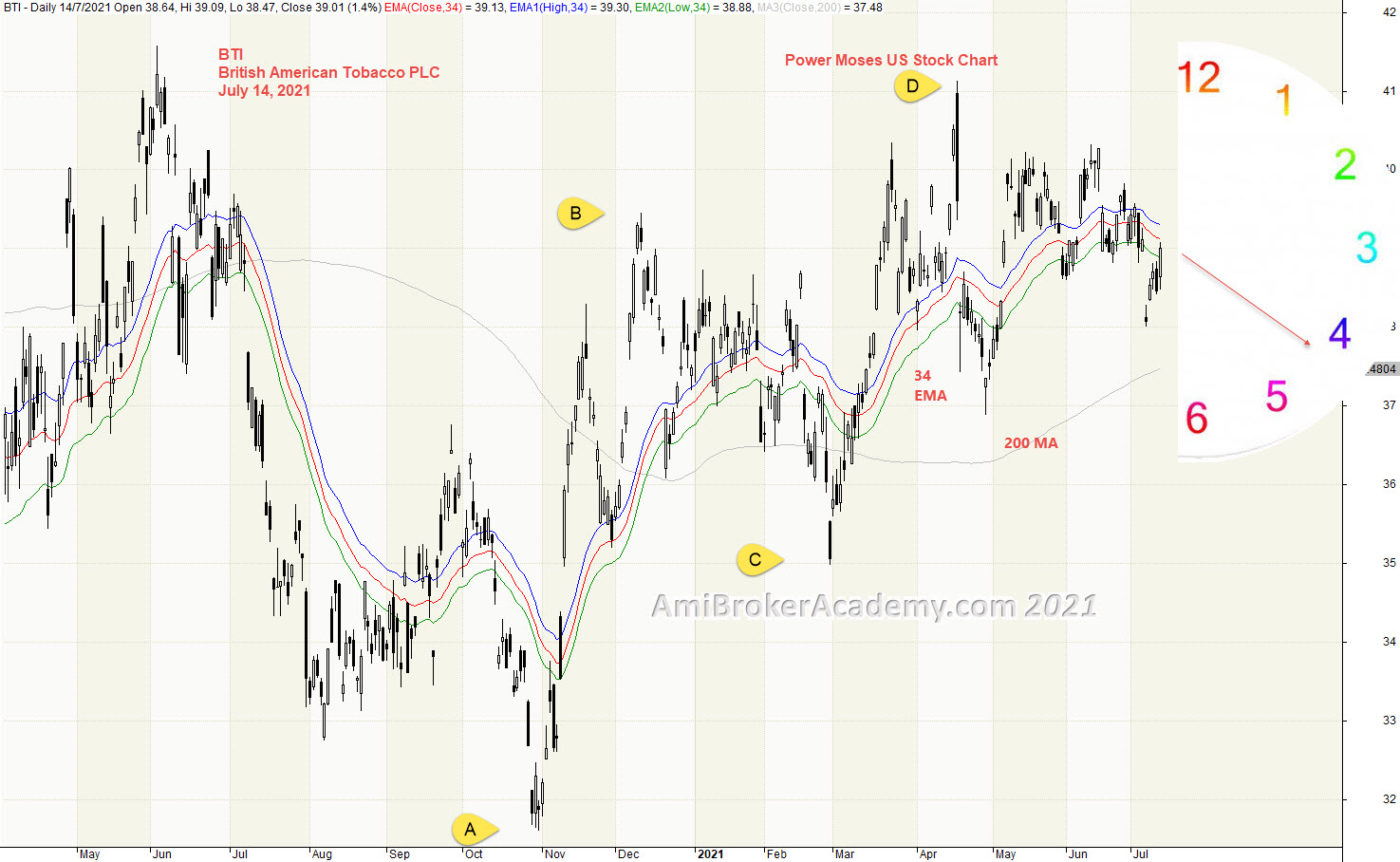
3) British American Tobacco PLC and River
Moving Average is a great visual tool, You can find it very useful in the very choppy price action like the chart below. So, simple buy when price action above River, and sell when the price action resisted by River. So, buy support and sell resistance.
You can also spot H M Gartley wave pattern too. Simple yet powerful, AB=CD pattern.
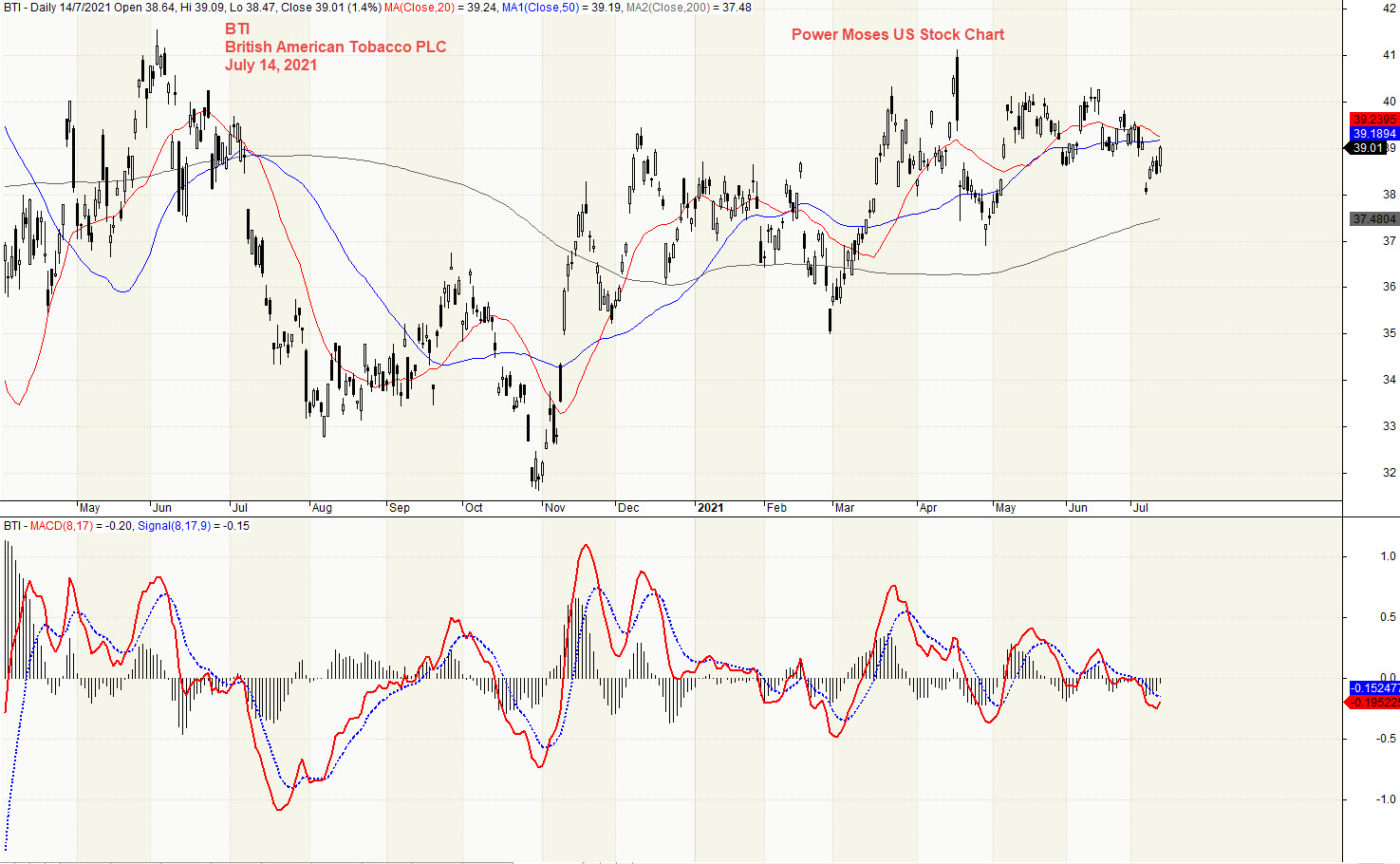
4) British American Tobacco PLC and MACD
Picture worth a thousand words, the price action after the low, begin to form higher high. But, you see the MACD goes down, form lower high, MACD Divergence.
As we told you before, do not play play with simple tool like MACD. Find a good entry point to take partial profit. Have fun!
Moses Power Charting
Official AmiBrokerAcademy.com Charting
Disclaimer
The above result is for illustration purpose. It is not meant to be used for buy or sell decision. We do not recommend any particular stocks. If particular stocks of such are mentioned, they are meant as demonstration of Amibroker as a powerful charting software and MACD. Amibroker can program to scan the stocks for buy and sell signals.
These are script generated signals. Not all scan results are shown here. The MACD signal should use with price action. Users must understand what MACD and price action are all about before using them. If necessary you should attend a course to learn more on Technical Analysis (TA) and Moving Average Convergence Divergence, MACD.
Once again, the website does not guarantee any results or investment return based on the information and instruction you have read here. It should be used as learning aids only and if you decide to trade real money, all trading decision should be your own.
We learn from many past and present great traders. Kudo to these master.