September 1, 2017
MACD Indicator
We like MACD. MACD is a leading indicator, lead the trend change. We shall study the MACD in the next posting. Okay?
BABA Alibaba Group Holding
Picture worth a thousand words. We see the share price continues to form higher high. Share price is now approaching $180. This is a good round number, 180. May be 200 will be even better. Now, the question is can the price hits the 180 or 200 dollars. Of course can, the question is when will that happen.
Now common sense tell us that in order for the price action to bounce up higher, it need energy. In other words, the price action has to move low to get enough energy to bounce up and hit 180 or 200. Watch it.
Oh, yes.
On the chart, we indicate all the good levels to watch.
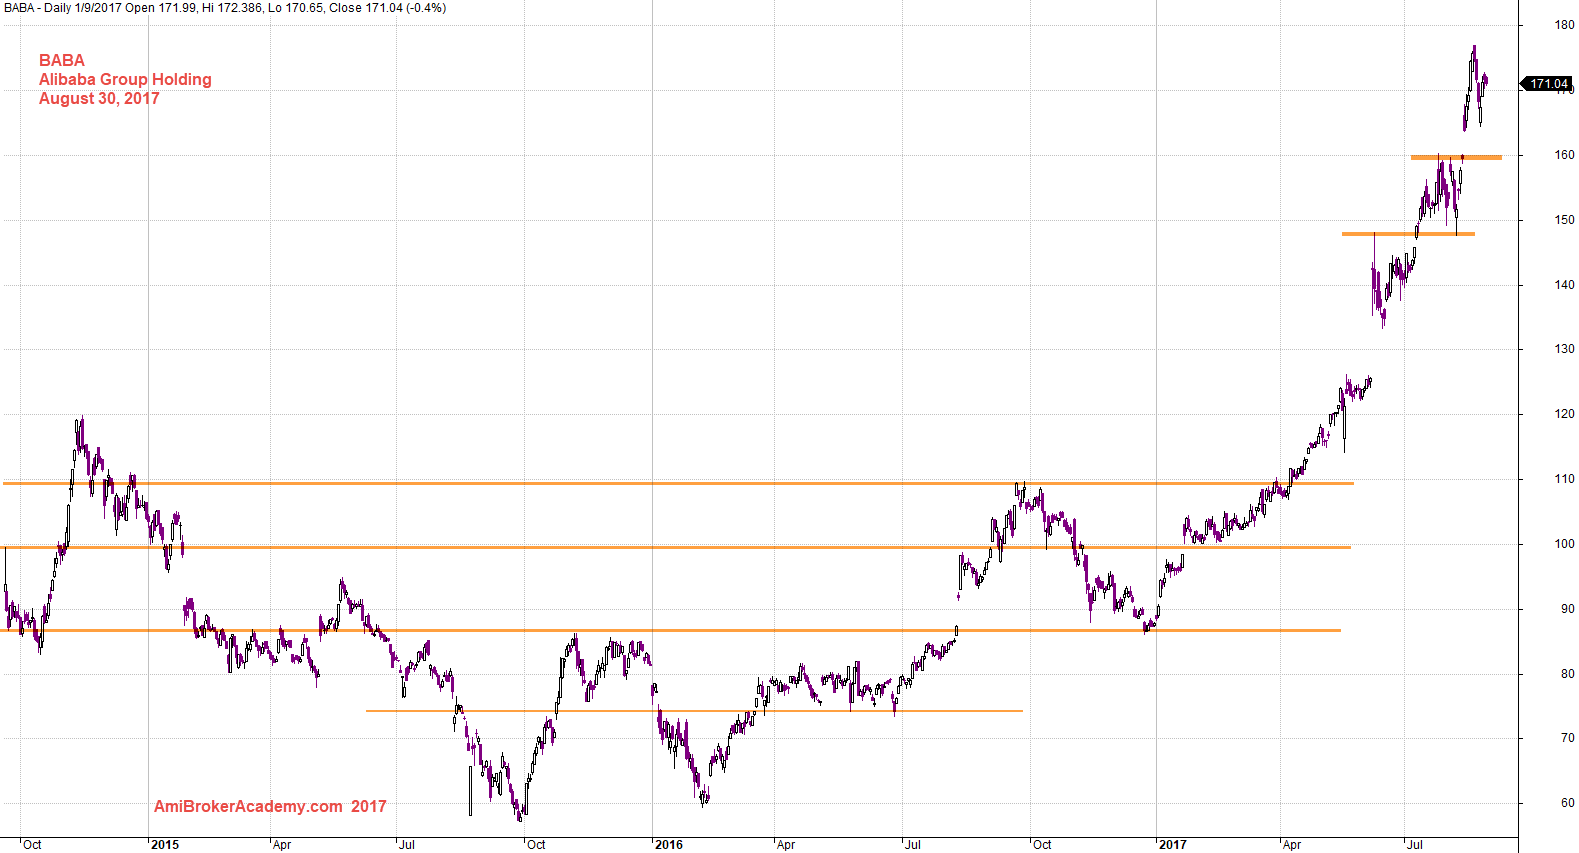
August 30, 2017 Alibaba Group Holding and Support Resistance
Alibaba Group Holding Line Chart
When you want to see the wave count clearer, turn on line chart, see chart below.
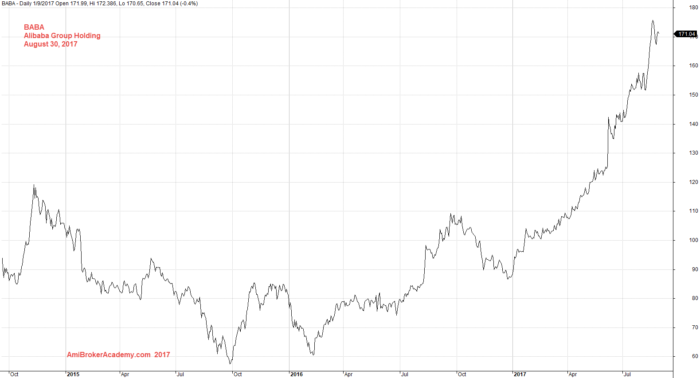
August 30, 2017 Alibaba Group Holding Line Chart
Alibaba Group Holding and Channel
Look to your left, that is the IPO price on the first candle. For this stock, we like to see chart from its IPO. If you bought the stock and hold till now. You can laughing to the bank, but but not easy. Many the heart can not take it. So trade within your mean, and responsibly. And if you are someone trade adviser, please never, and never tell your client or clients you see, I told you right, “hold” and you will be successful. … Remember, and always remember, in trading there isn’t a right or wrong. It is just all about timing. When you enter the market and when you take profit. Okay?! Trading is an endless journey and learning.
See the channel, 2017 is even more bullish as compare to 2016.
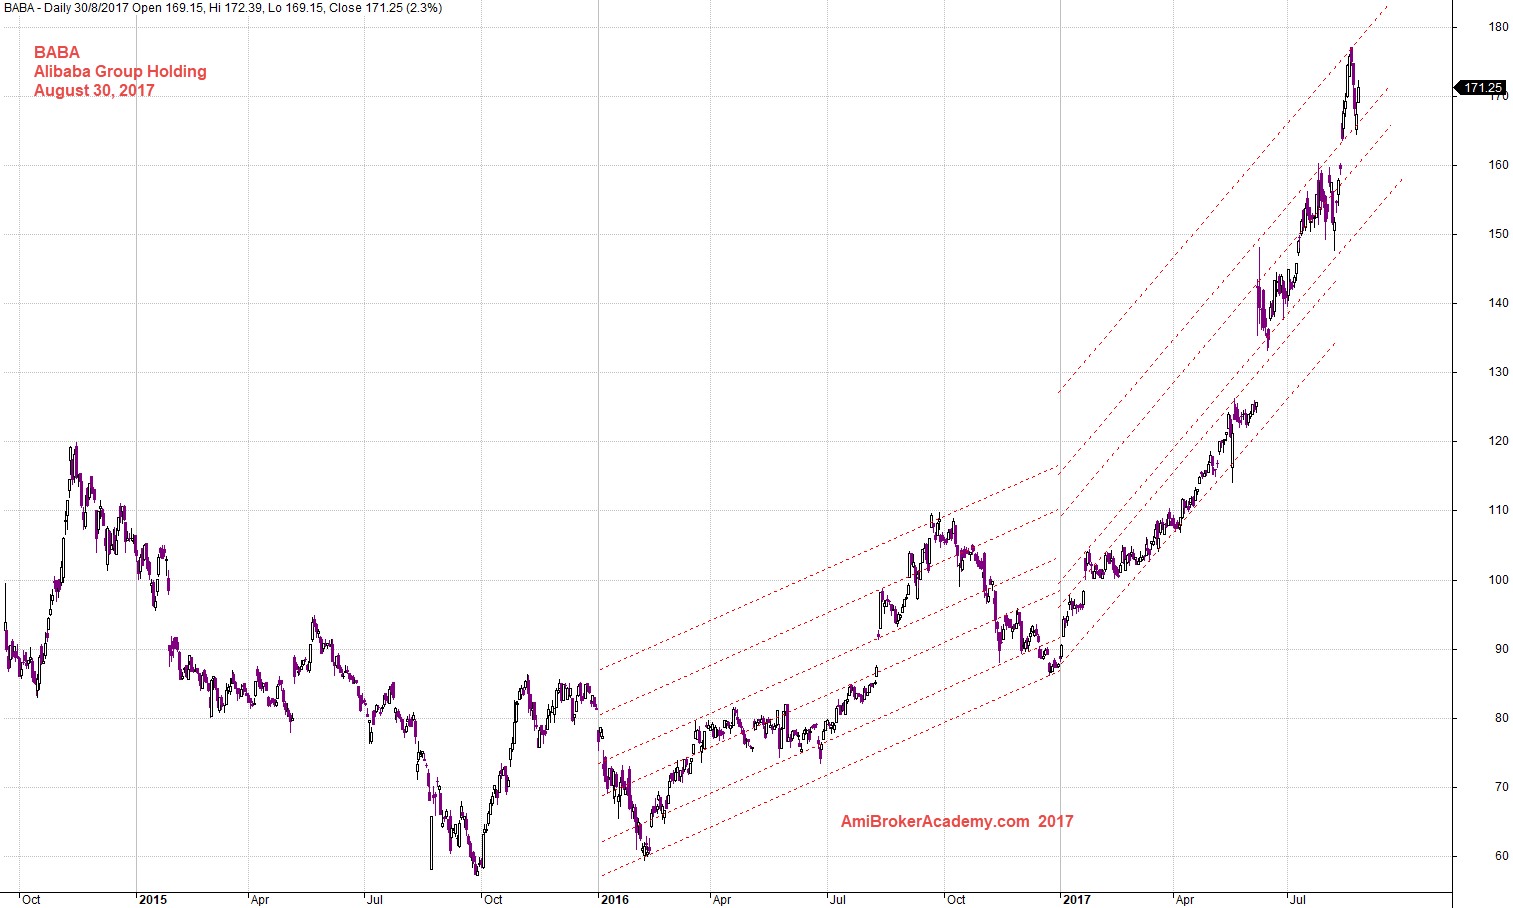
August 30, 2017 Alibaba Group Holding and Channel
Alibaba Group Holding and 34 MA Band
We do not invent tool or indicator. We try to understand what the indicator or teachers has said. We try to apply what we understand on the chart and hope it make sense.
So, over here, we do not claim someone copy our idea. But we do care, people just take our charts and says they did it. Ha ha. But, even someone did that, what can we do? Nothing. If you do need to copy, just reference us, we will be very appreciate your kind gesture. Enjoy you being here. Have fun!
See MA, is a great tool for trend. See chart for more.
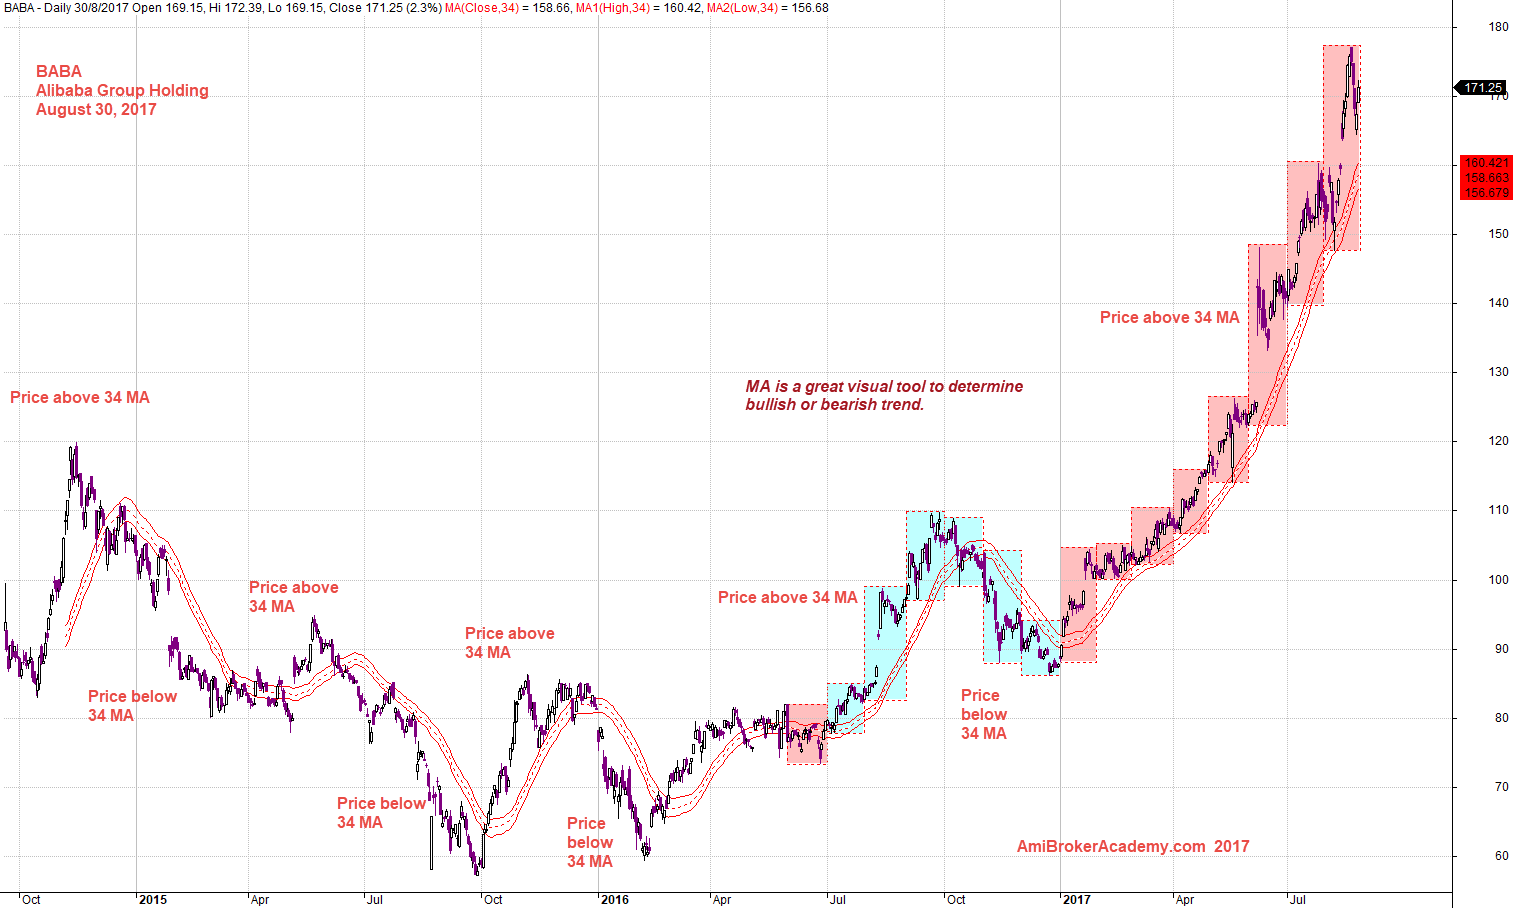
August 30, 2017 Alibaba Group Holding and 34 MA Band
Alibaba Group Holding and Fibonacci
Fibonacci is a great level to check the retracement and extension.
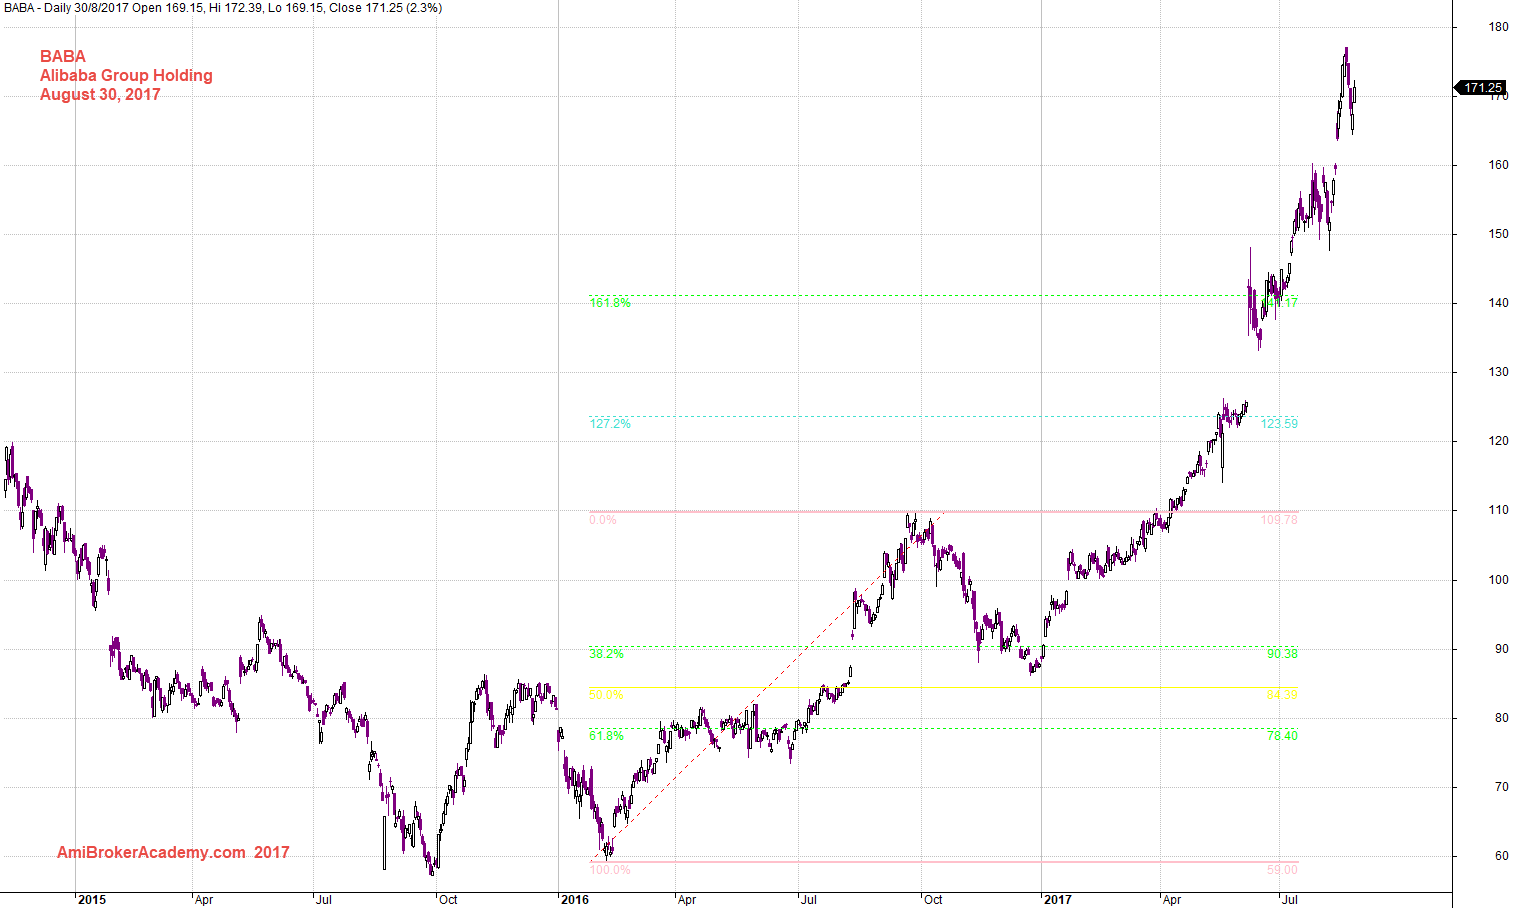
August 30, 2017 Alibaba Group Holding and Fibonacci Retracement and Extension
Thanks for visit the site here. You could also find free MACD scan here in this site too.
Moses
AmiBrokerAcademy.com
Disclaimer
The above result is for illustration purpose. It is not meant to be used for buy or sell decision. We do not recommend any particular stocks. If particular stocks of such are mentioned, they are meant as demonstration of Amibroker as a powerful charting software and MACD. Amibroker can program to scan the stocks for buy and sell signals.
These are script generated signals. Not all scan results are shown here. The MACD signal should use with price action. Users must understand what MACD and price action are all about before using them. If necessary you should attend a course to learn more on Technical Analysis (TA) and Moving Average Convergence Divergence, MACD.
Once again, the website does not guarantee any results or investment return based on the information and instruction you have read here. It should be used as learning aids only and if you decide to trade real money, all trading decision should be your own.