September 1, 2017
September 1, 2017 Shanghai Fenghwa and MACD
丰华股份 600615.SS Shanghai Fenghwa and MACD Signals
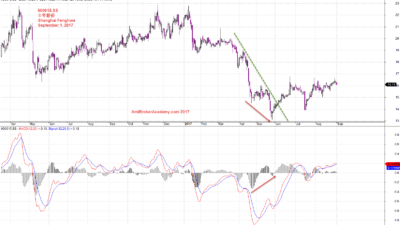
Picture worth a thousand words. See chart for more. Share price is moving in zigzag. The share price reach the bottom and bounce; forms a higher low. If you see carefully, you probably see a head and shoulders. Is this going to be a sign of reversalt? I do not know.
On another hand the MACD signal begin to form higher low. Is this a signal a trend is ending and about to reverse. Will see.
丰华股份 600615.SS Shanghai Fenghwa and Support Resistance
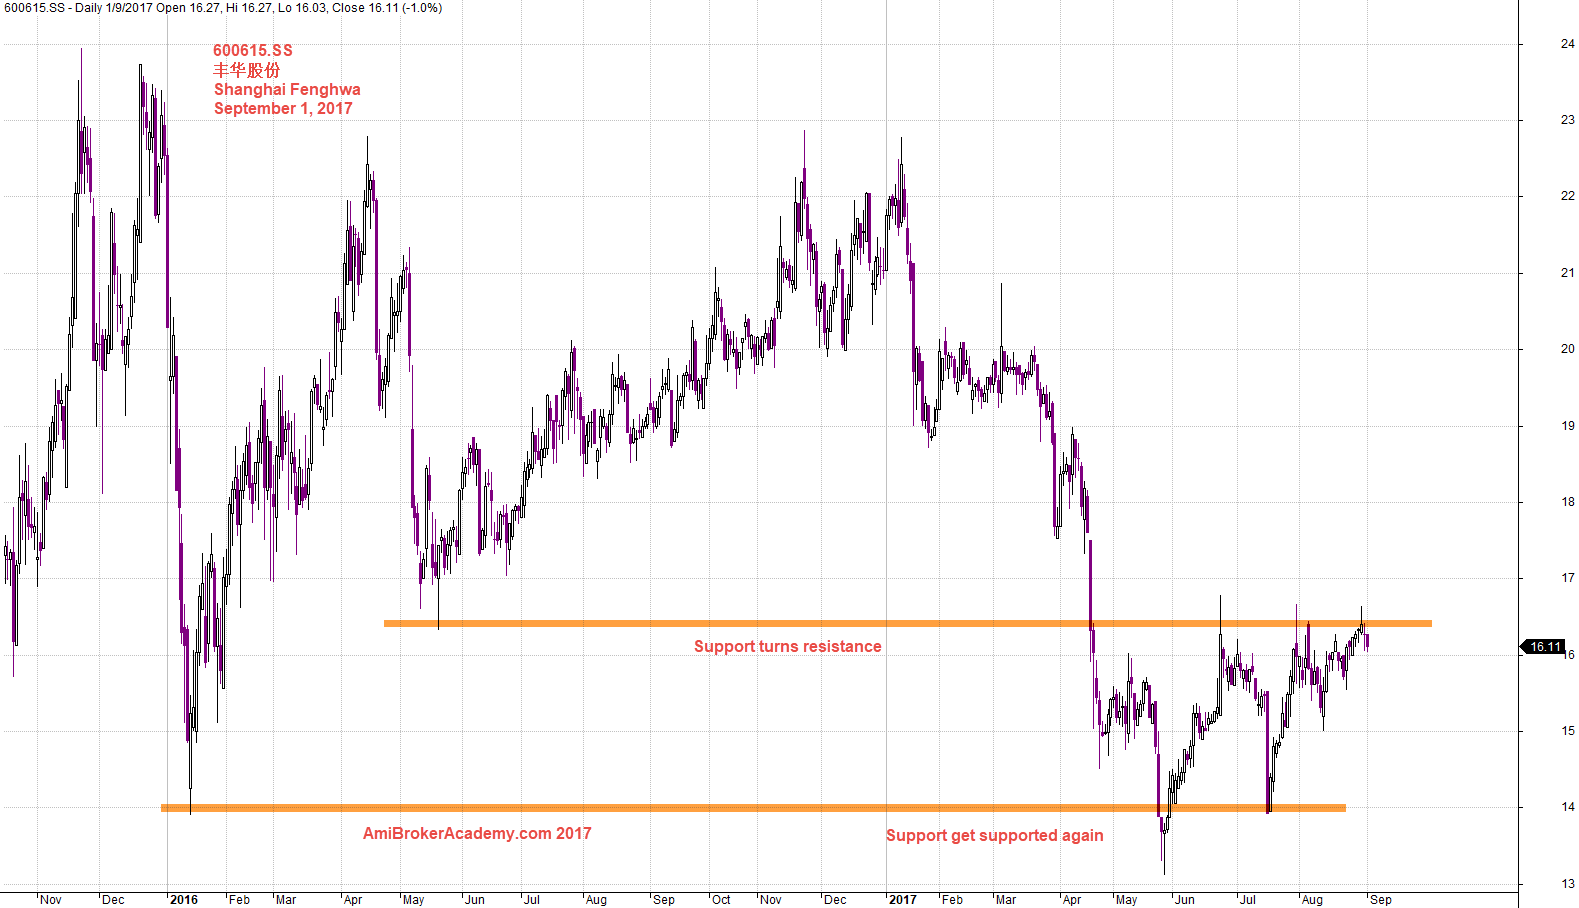
Picture worth a thousand words, see chart. We see support turns resistance, and support gets supported again.
Now, the price action has been resisted and the same level has been retest a few time. Strong, very strong as the level did not get breakout so far. Will see.
September 1, 2017 Shanghai Fenghwa and Support Resistance
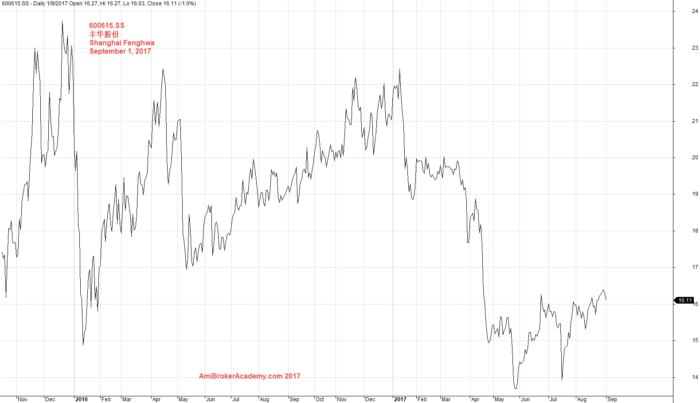
600615.SS Shanghai Fenghwa丰华股份 Line Chart
Can you see the wave count better?
September 1, 2017 Shanghai Fenhwa Line Chart
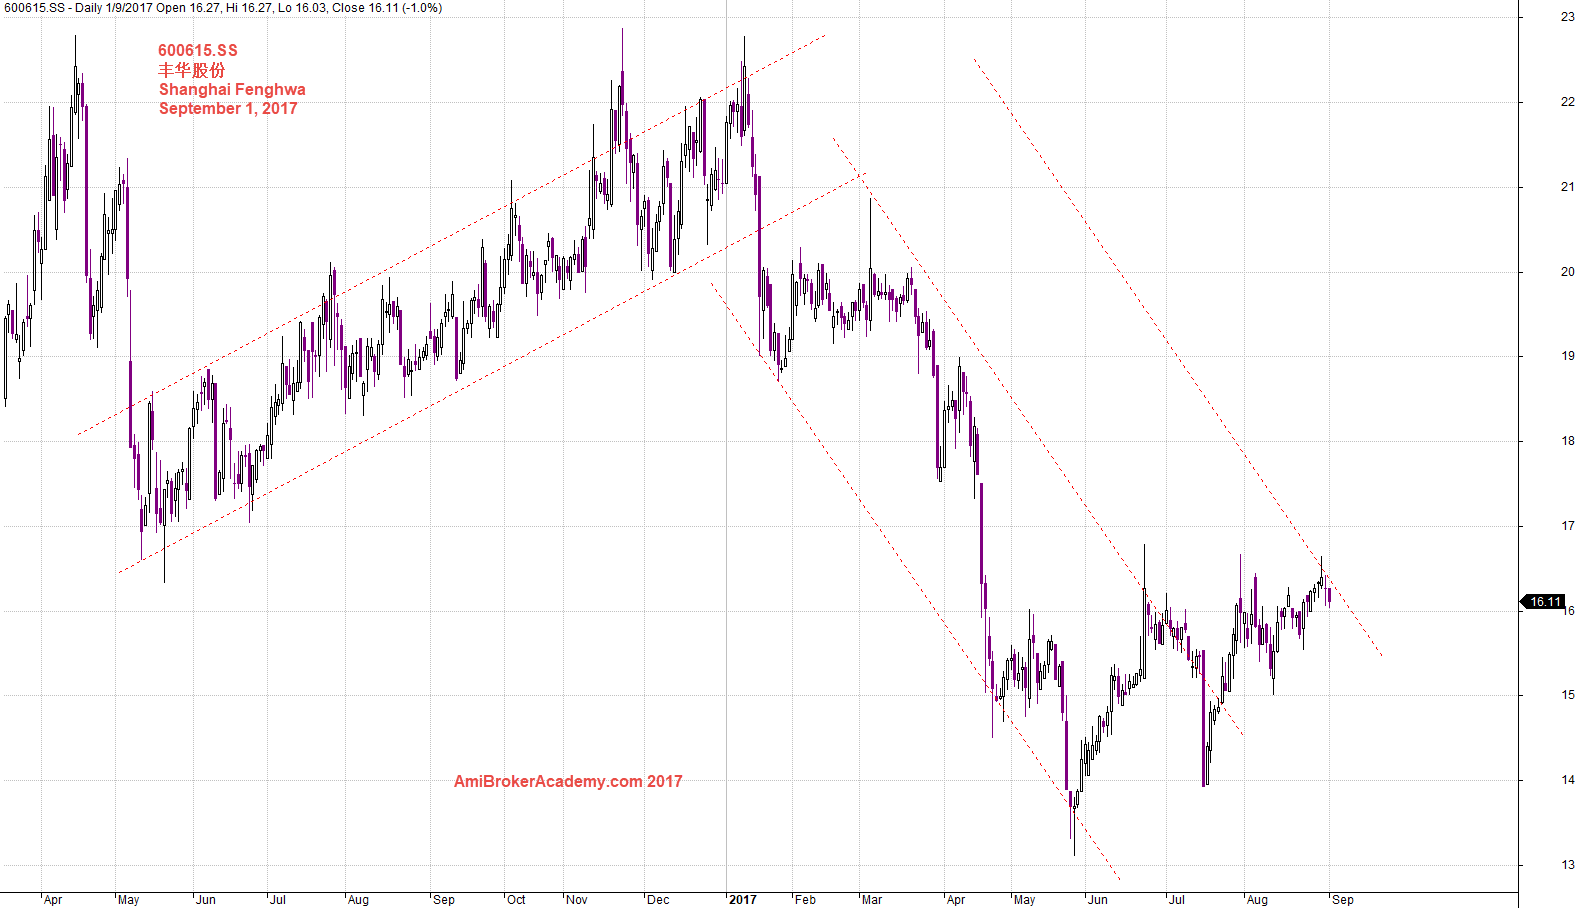
600615.SS 丰华股份 Shanghai Fenghwa and Channel
See chart for more, picture worth a thousand words. The trend has double top, the price action has ended the bullish trend and begin the bearish trend. We see the last part of the trend is now sideways.
September 1, 2017 Shanghai Fenghwa and Channel
丰华股份 600615.SS Shanghai Fenghwa and Fibonacci
After the price action breakout the low, swing low and get resisted by the low. The price action has breakout lower than the extension of 127%.
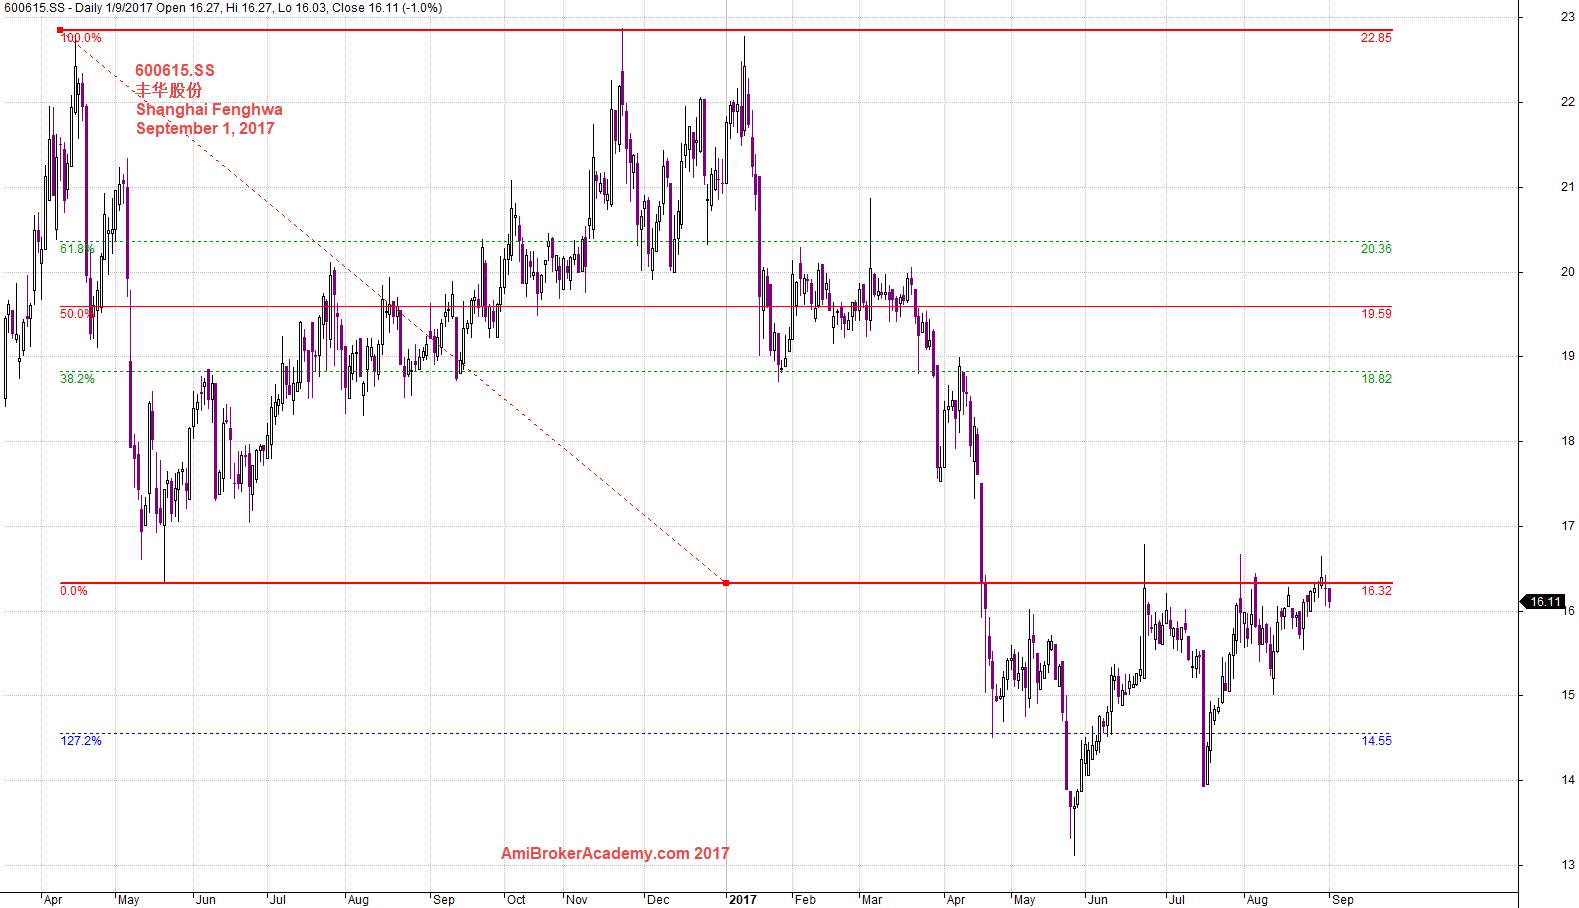
September 1, 2017 Shanghai Fenghwa and Fibonacci Retracement
Thanks for visit the site here. You could also find free MACD scan here in this site too.
Moses
AmiBrokerAcademy.com
Disclaimer
The above result is for illustration purpose. It is not meant to be used for buy or sell decision. We do not recommend any particular stocks. If particular stocks of such are mentioned, they are meant as demonstration of Amibroker as a powerful charting software and MACD. Amibroker can program to scan the stocks for buy and sell signals.
These are script generated signals. Not all scan results are shown here. The MACD signal should use with price action. Users must understand what MACD and price action are all about before using them. If necessary you should attend a course to learn more on Technical Analysis (TA) and Moving Average Convergence Divergence, MACD.
Once again, the website does not guarantee any results or investment return based on the information and instruction you have read here. It should be used as learning aids only and if you decide to trade real money, all trading decision should be your own.