July 1, 2017
Before We Look Back the Last Six Months; 2017 Half-year Results
Step Back and See the Last Ten Years
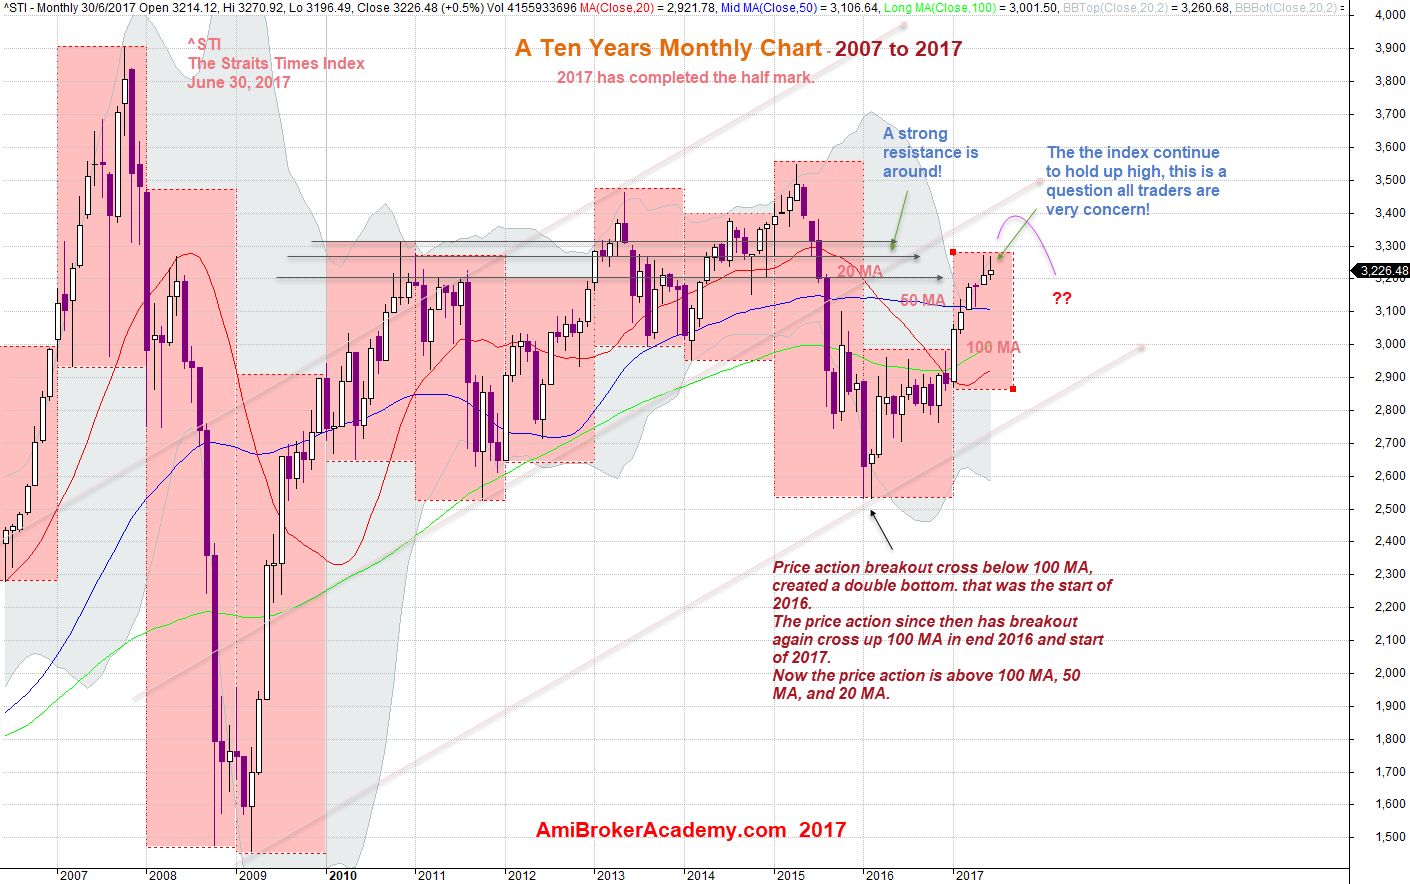
A Ten Years Monthly Chart – The Straits Times Index
Picture worth a thousand words.
The channel slopping from the bottom left to the top right, the trend is still up. Technically, of course many may disagree. But it is okay, different eyes see different things. …
The price action after the peak in start of 2017, the price action fail the retest the high a few times, in 2010, 2013, 2015, now the index is forming a lower high. The price action begin to drift south in 2015 until beginning of 2016, many of the traders got panic as the low is retesting 2011 low. What if the price action break through the support, the fall can reach the 2009 low, the ten years low in this chart.
Now the price action has reached the resistance zone that formed by the 2010, 2011, 2012 three years high. Wow, what a great level of resistance. A solid three years high. It got to be strong, very strong. If the breakout can can successful, the speed and the strength got to be very powerful. Watch out.
Just a clue to you, you can only find this kind of information, or signal only in such as kind of chart.
Do you see many bulls got trapped in 2013, 2014 and 2015? Many assume the breakout got to be powerful, but if you will look at the context you may think twice. As the bulls were weaken after a long journey from 2011.
So, we see a likely pullback to build the strength beform breakout the strong resistance. And again the breakout many take a few pullback to strengthen the momentum. Watch out and enjoy the ride.
June 30, 2017 The Straits Times Index Ten Years Monthly Results
If you were here before, can you recall the following analysis a year ago …
see link and the chart below, …
^STI Straits Times Index Monthly Chart
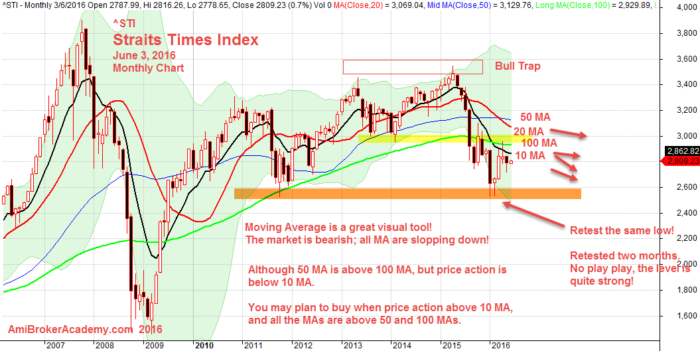
June 3, 2016 Straits Times Index Monthly Chart
Two Parallel Trendlines Become Channel, The Straits Times Index
Picture worth a thousand words. As we mentioned, we are now at or near the strong resistance zone. What have you got from the chart below.
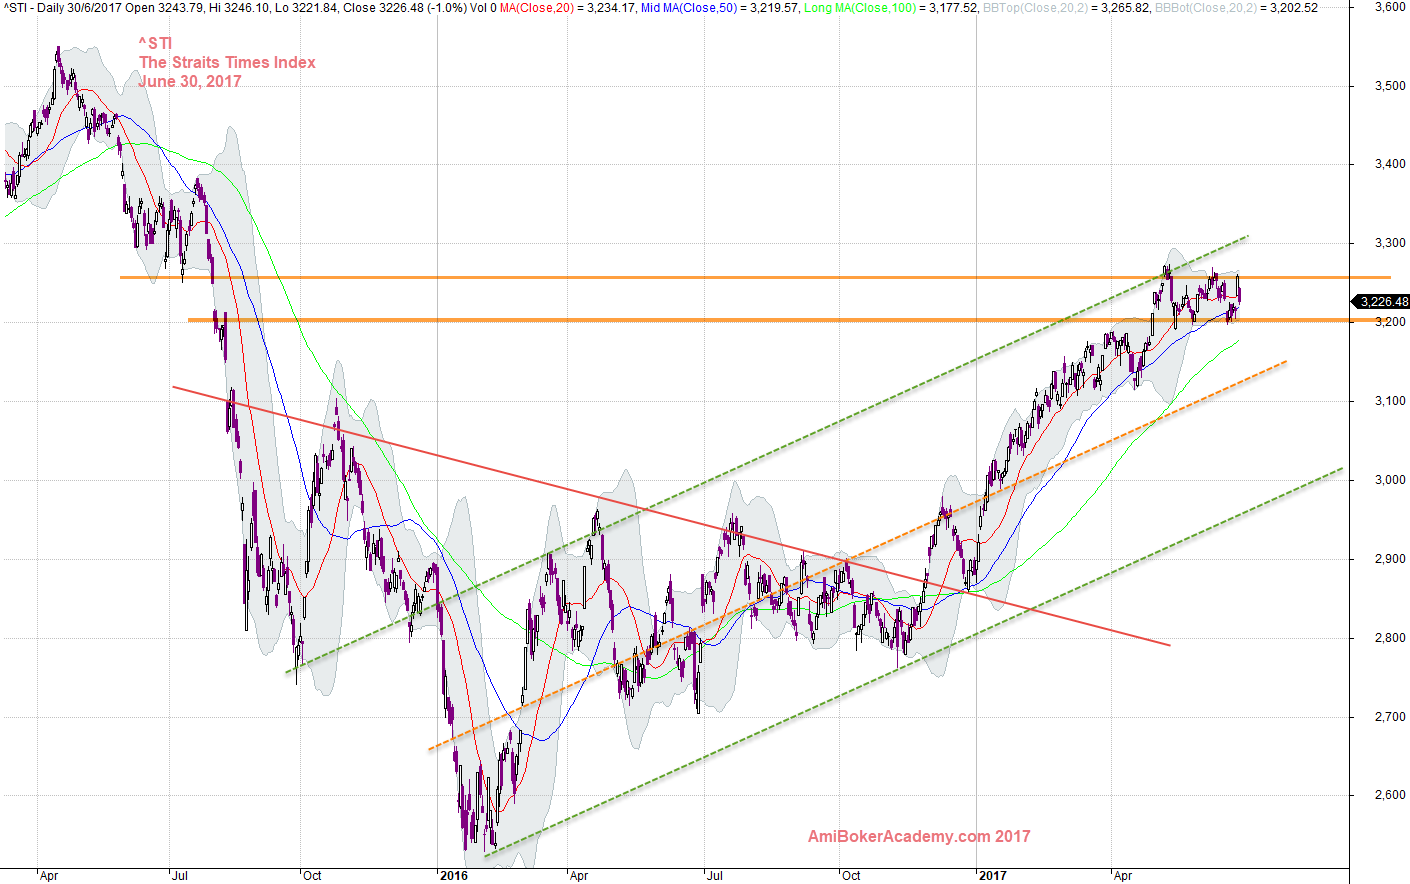
June 30, 2017 The Straits Times Index and Trendlines
Moses Stock Analysis
AmiBrokerAcademy.com
Disclaimer
The above result is for illustration purpose. It is not meant to be used for buy or sell decision. We do not recommend any particular stocks. If particular stocks of such are mentioned, they are meant as demonstration of Amibroker as a powerful charting software and MACD. Amibroker can program to scan the stocks for buy and sell signals.
These are script generated signals. Not all scan results are shown here. The MACD signal should use with price action. Users must understand what MACD and price action are all about before using them. If necessary you should attend a course to learn more on Technical Analysis (TA) and Moving Average Convergence Divergence, MACD.
Once again, the website does not guarantee any results or investment return based on the information and instruction you have read here. It should be used as learning aids only and if you decide to trade real money, all trading decision should be your own.