July 1, 2017
Before We Look Back the Last Six Months; 2017 Half-year Results
Step Back and See the Last Ten Years
Half-year Results | 2017 Has Completed Half Mark | United Overseas Bank
UOB, Singapore listed Stock.
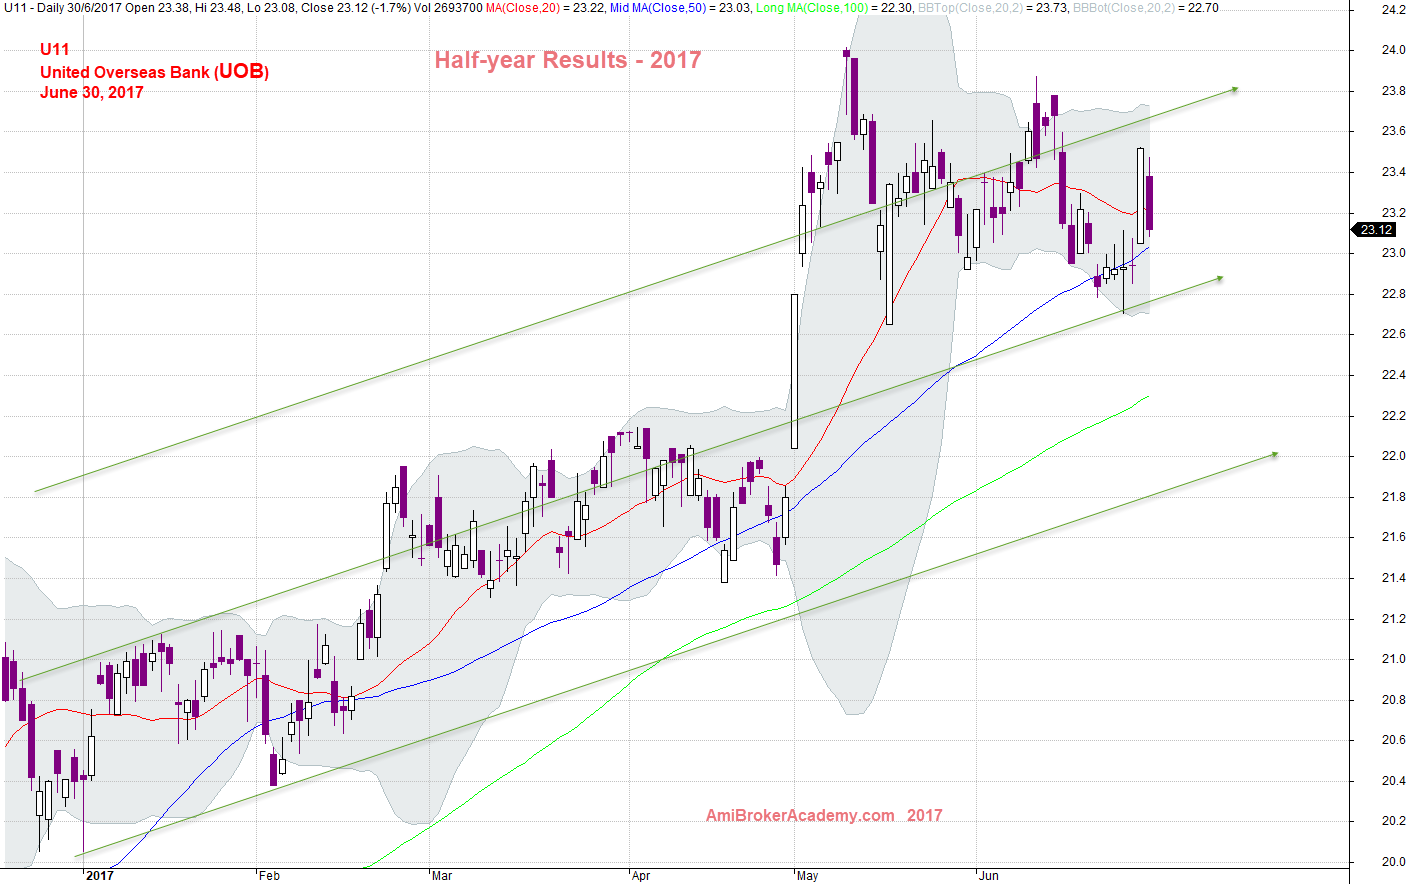
Picture worth a thousand words. Connecting the low and draw a trendline, copy and paste the trendline at the high of the price, you will see channel. The channel slopping from the bottom left to the top right, the trend is still up.
The channel slopping from the bottom left to the top right, the trend is still up.
We see the price action moving from the lower channel and breakout to next level channel. This is the half year 2017 UOB stock price performance. Can you read the Singapore economy from here? I can not. By one bank’s stock price and decide the entire country economy is really too much. Do not forget a bank performance consist of many elements, so do not just assume.
If you are details enough, you will see the price is continue to form low high and lower low. However, the recent low is retest the first pullback from the high in May. From the upper channel, the price is retesting the lower trendline of the channel. So, trade what you see. WOMD, wait one more day to before you trade again.
June 30, 2017 United Overseas Bank UOB Half-year Results
Two Parallel Trendlines Become Channel, The Straits Times Index
Reference it to the Straits Times Index, you may get some supporting reason. Ha ha. Have fun!
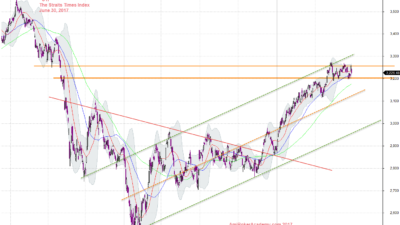
June 30, 2017 The Straits Times Index and Trendlines
United Overseas Bank UOB U11 and MACD Signals
MACD Cross Up Fial, otherwise the trend will be even more bullish. Right? May be.
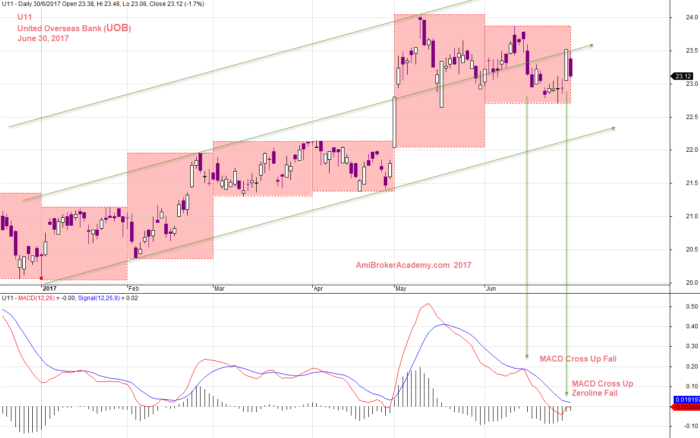
June 30, 2017 UOB United Overseas Bank and MACD Signals
When you analyse one bank in Singapore market, you must also check out the other two major local bank, OCBC, and DBS.
Moses Stock Analysis
AmiBrokerAcademy.com
Disclaimer
The above result is for illustration purpose. It is not meant to be used for buy or sell decision. We do not recommend any particular stocks. If particular stocks of such are mentioned, they are meant as demonstration of Amibroker as a powerful charting software and MACD. Amibroker can program to scan the stocks for buy and sell signals.
These are script generated signals. Not all scan results are shown here. The MACD signal should use with price action. Users must understand what MACD and price action are all about before using them. If necessary you should attend a course to learn more on Technical Analysis (TA) and Moving Average Convergence Divergence, MACD.
Once again, the website does not guarantee any results or investment return based on the information and instruction you have read here. It should be used as learning aids only and if you decide to trade real money, all trading decision should be your own.