January 29, 2017
Moses Trading Blog Site – AmiBrokerAcademy.com
Thank you for visiting the blog site. No one like us doing analysis like what you read here. Let your friend know if you enjoy to being here.
Welcome to Moses’s US Stock Analysis @ AmiBrokerAcademy.com.
Blackstone Daily and 34 EMA Wave
We can spot clear leg 1, leg 2 before the price action close above the 34 EMA Wave.
We see the price action floating above the 34 EMA Wave. The wave direction is in between one and two o’clock. See chart for details.
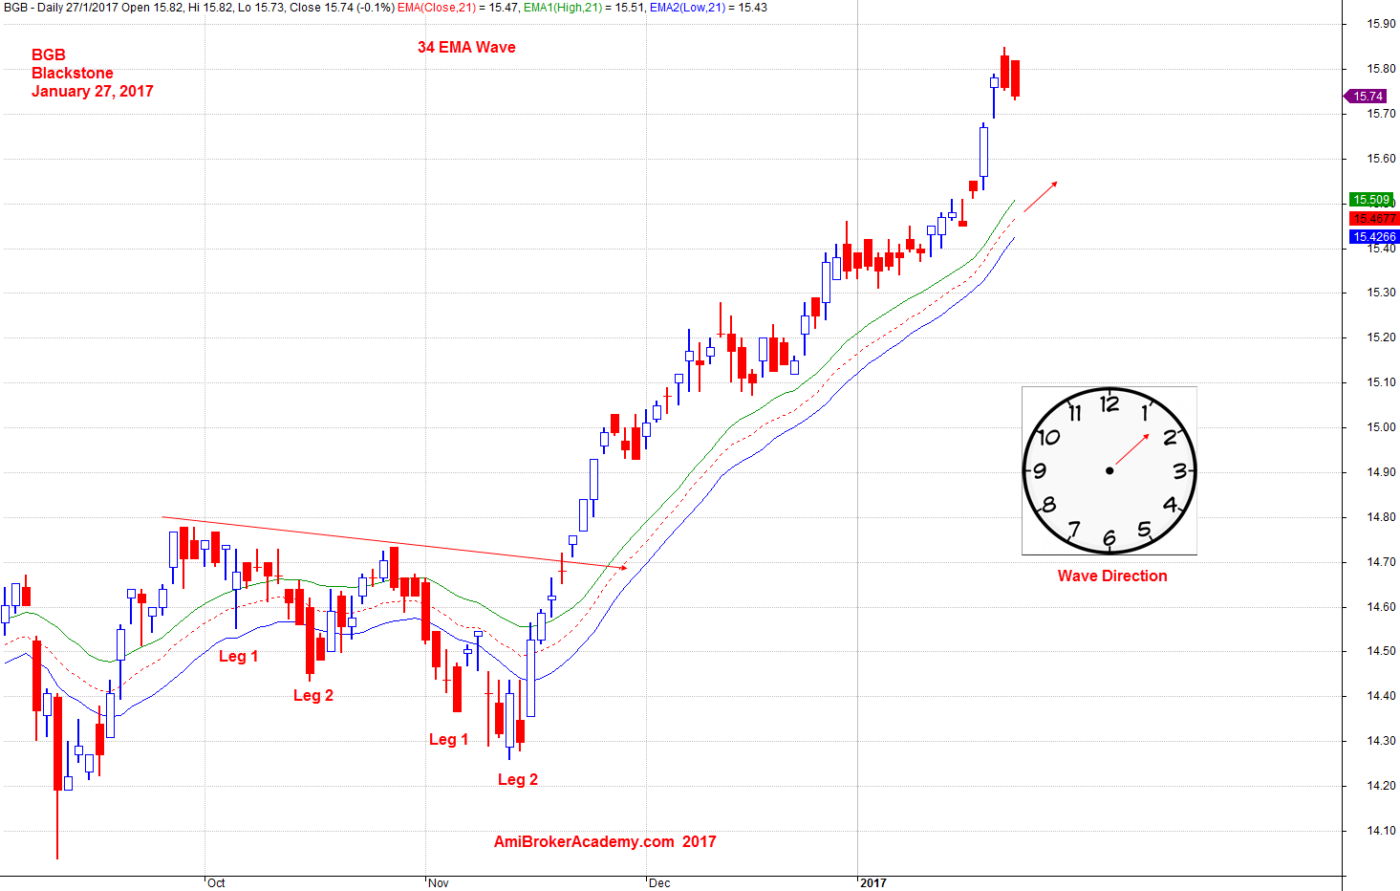
January 27, 2017 Blakcstone and 34 EMA Wave
BGB Blackstone Daily and MACD Indicator
Let’s look at the chart using a different an approach, when we can not see much clue from the 34 EMA Wave.
MACD is a leading indicator. We see divergence, a signal on trend change. Watch out.
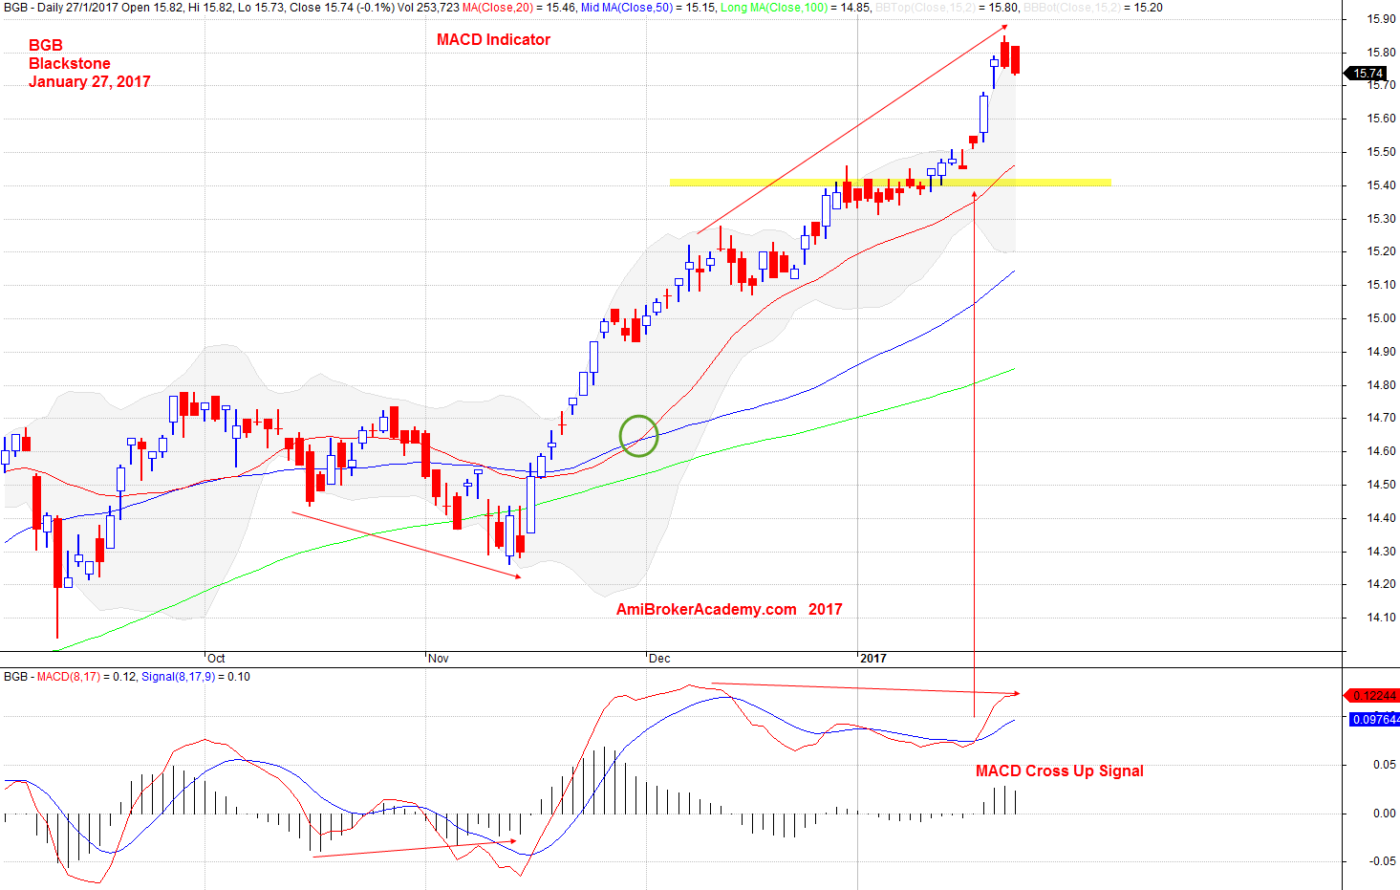
January 27, 2017 Blackstone and MACD Indicator
Moses
AmiBrokerAcademy.com
Disclaimer
The above result is for illustration purpose. It is not meant to be used for buy or sell decision. We do not recommend any particular stocks. If particular stocks of such are mentioned, they are meant as demonstration of Amibroker as a powerful charting software and MACD. Amibroker can program to scan the stocks for buy and sell signals.
These are script generated signals. Not all scan results are shown here. The MACD signal should use with price action. Users must understand what MACD and price action are all about before using them. If necessary you should attend a course to learn more on Technical Analysis (TA) and Moving Average Convergence Divergence, MACD.
Once again, the website does not guarantee any results or investment return based on the information and instruction you have read here. It should be used as learning aids only and if you decide to trade real money, all trading decision should be your own.