January 29, 2017
US Stock MACD Scan for Trading Close January 27, 2017
Welcome to top MACD blog site, Moses’s US Stock MACD Scan at AmiBrokerAcademy.com. January 27, 2017 one-day US stock MACD scan.
The following are one-day MACD scan on US Stocks with Amibroker using MACD Screening Script. This stock screening narrow it to stocks to value between 51 dollars to 250 dollars with at least 1,000,000 shares changed harnds.
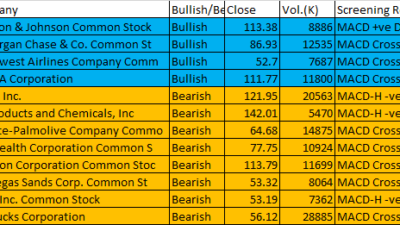
| Ticker | Company | Date | Bullish/Bearish | Close | Vol.(K) | Screening Result |
| JNJ | Johnson & Johnson Common Stock | 27/1/2017 | Bullish | 113.38 | 8886 | MACD +ve Divergence |
| JPM | JP Morgan Chase & Co. Common St | 27/1/2017 | Bullish | 86.93 | 12535 | MACD Cross-Up Signal |
| LUV | Southwest Airlines Company Comm | 27/1/2017 | Bullish | 52.7 | 7687 | MACD Cross-Up ZeroLine |
| NVDA | NVIDIA Corporation | 27/1/2017 | Bullish | 111.77 | 11800 | MACD Cross-Up Signal |
| AAPL | Apple Inc. | 27/1/2017 | Bearish | 121.95 | 20563 | MACD-H -ve Divergence |
| APD | Air Products and Chemicals, Inc | 27/1/2017 | Bearish | 142.01 | 5470 | MACD-H -ve Divergence |
| CL | Colgate-Palmolive Company Commo | 27/1/2017 | Bearish | 64.68 | 14875 | MACD Cross-Down Signal |
| CVS | CVS Health Corporation Common S | 27/1/2017 | Bearish | 77.75 | 10924 | MACD Cross-Down ZeroLine |
| CVX | Chevron Corporation Common Stoc | 27/1/2017 | Bearish | 113.79 | 11699 | MACD Cross-Down ZeroLine |
| LVS | Las Vegas Sands Corp. Common St | 27/1/2017 | Bearish | 53.32 | 8064 | MACD Cross-Down Signal |
| NKE | Nike, Inc. Common Stock | 27/1/2017 | Bearish | 53.19 | 7362 | MACD-H -ve Divergence |
| SBUX | Starbucks Corporation | 27/1/2017 | Bearish | 56.12 | 28885 | MACD Cross-Down Signal |
January 27, 2017 One-day US Stock MACD Scan
These are script generated signals. They are not meant to be used for buy or sell decisions. We do not vouch for their accuracy. They are meant as demonstration of Amibroker’s functionality. Not all scan results are shown here. Readers must understand what MACD is all about before using them.
We have covered how you can use the scan in another post. If you are not sure, check it out.
Moses Stock Scan
AmiBrokerAcademy.com
Disclaimer
The above result is for illustration purpose. It is not meant to be used for buy or sell decision. We do not recommend any particular stocks. If particular stocks of such are mentioned, they are meant as demonstration of Amibroker as a powerful charting software and MACD. Amibroker can program to scan the stocks for buy and sell signals.
These are script generated signals. Not all scan results are shown here. The MACD signal should use with price action. Users must understand what MACD and price action are all about before using them. If necessary you should attend a course to learn more on Technical Analysis (TA) and Moving Average Convergence Divergence, MACD.
Once again, the website does not guarantee any results or investment return based on the information and instruction you have read here. It should be used as learning aids only and if you decide to trade real money, all trading decision should be your own.