January 30, 2017
Moses Trading Blog Site – AmiBrokerAcademy.com
Thank you for visiting the amibrokeracademy.com blog site. No one like us doing analysis like what you read here. Let your friend know if you enjoy to being here.
Will Alibaba make a different this year after Jack Ma met Trump? Will see.
Welcome to Moses’s US Stock Analysis @ AmiBrokerAcademy.com.
BABA is a hot stock that we at AmiBrokerAcademy.com like to visit from time to time to see their progress.
Alibaba Group Holding Weekly and MACD Indicator
We see double bottom and the breakout of neckline and throwback. In fact, moving average is a great visual tool. We see golden cross, we see price action supported by the 50 MA; the throwback after the breakout from the neckline was being supported.
MACD does not provide much clue in this chart. The key level, also the neckline that we drawn is a very important level. Can the setup of ABCD chart pattern be successful. Will see.
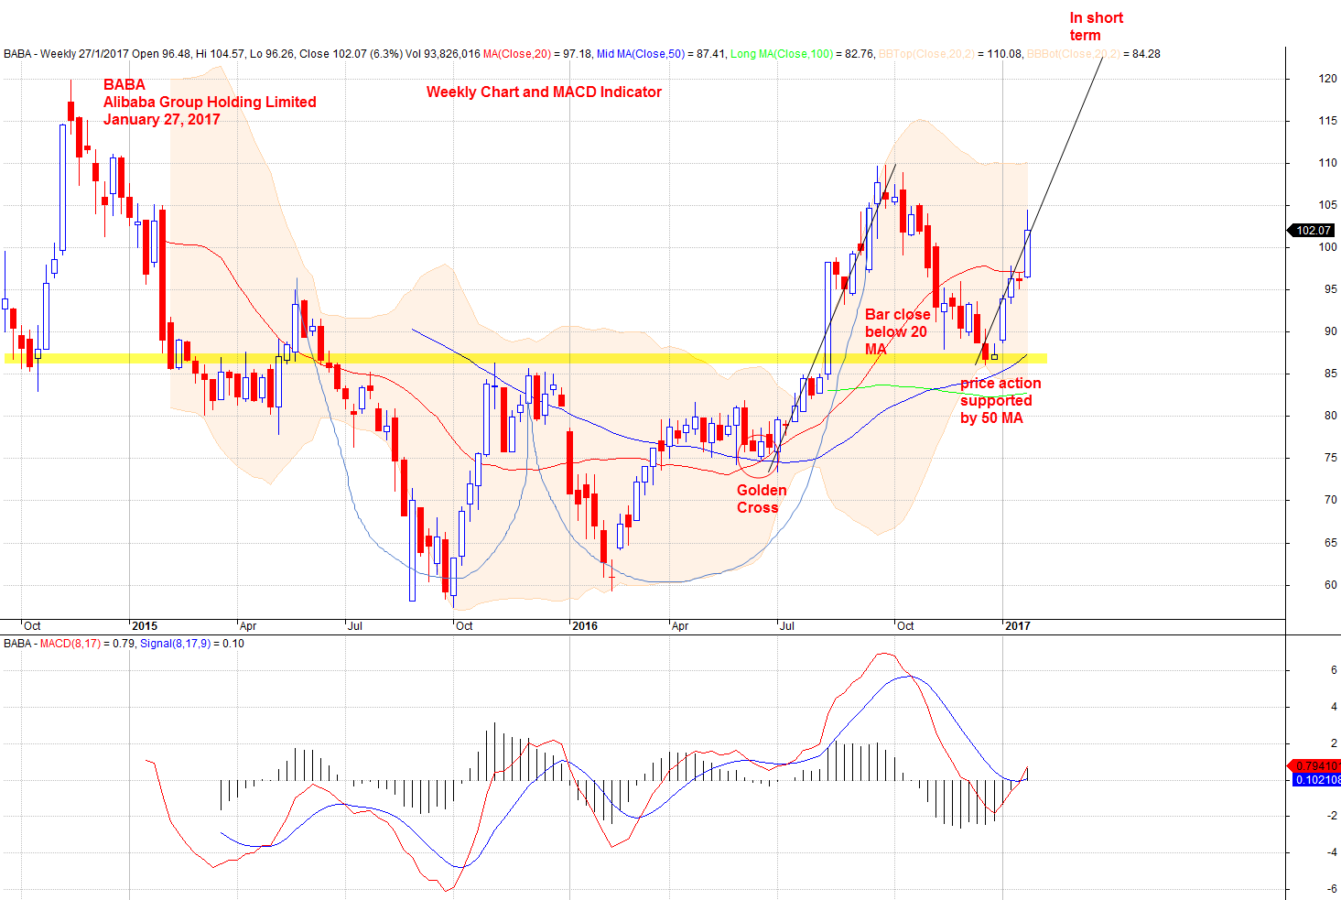
January 27, 2017 Alibaba Group Holding and MACD Indicator
BABA Alibaba Group Holding Weekly and 34 EMA Wave
Let’s look at the chart using a different approach, when we can not see much clue from MACD indicator.
Moving Average is a great visual tool. By putting three moving, high, low and close of the same moving averages will make the visual effect even more. See the chart for more.
The price action has to take the levels, a level at a time. Only when the first level break, then it make send to worry about the next level.
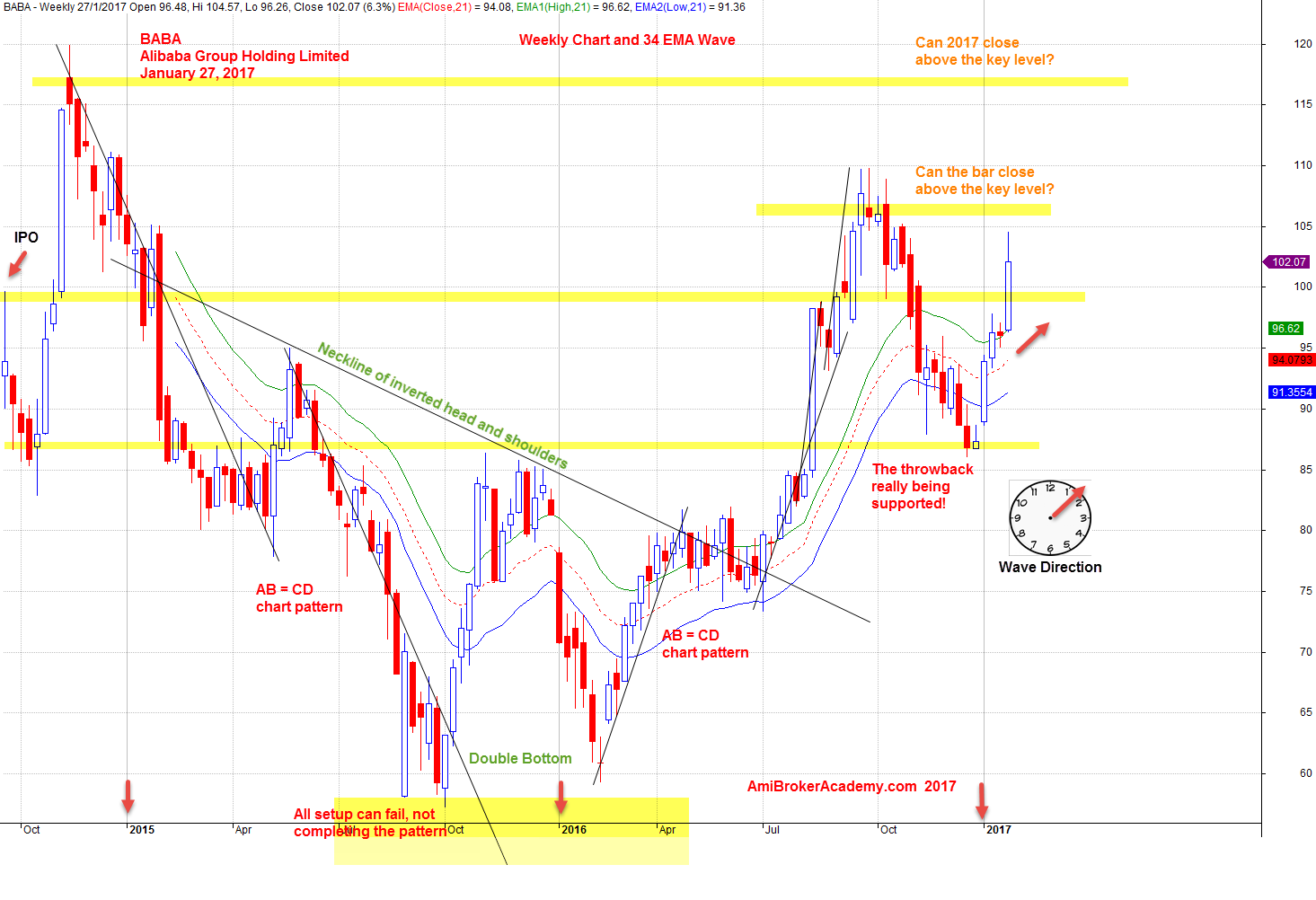
January 27, 2017 Alibaba Group Holding Weekly and 34 EMA Wave
Moses
AmiBrokerAcademy.com
Disclaimer
The above result is for illustration purpose. It is not meant to be used for buy or sell decision. We do not recommend any particular stocks. If particular stocks of such are mentioned, they are meant as demonstration of Amibroker as a powerful charting software and MACD. Amibroker can program to scan the stocks for buy and sell signals.
These are script generated signals. Not all scan results are shown here. The MACD signal should use with price action. Users must understand what MACD and price action are all about before using them. If necessary you should attend a course to learn more on Technical Analysis (TA) and Moving Average Convergence Divergence, MACD.
Once again, the website does not guarantee any results or investment return based on the information and instruction you have read here. It should be used as learning aids only and if you decide to trade real money, all trading decision should be your own.