January 30, 2017
With Mercury closely aligned with Pluto’s transformative energies in intense.
What are your the week trading strategy and decision? An encourage decision? There is no right no wrong, even if it isn not the right one, the fact that you have chosen can bring a sense of relief.
Other may have something to say about your choice. You’ll need to be strong and positive enough to drown out their voices and stick to your guns. At the same time, the present market scene can be very uplifting
Moses Trading Blog Site – AmiBrokerAcademy.com
Thank you for visiting the amibrokeracademy.com blog site. No one like us doing analysis like what you read here. Let your friend know if you enjoy to being here.
Welcome to Moses’s US Stock Analysis @ AmiBrokerAcademy.com.
Apple In stock is also a stock that we analyse.
Apple Inc Weekly and 34 EMA Wave
Let’s study the chart using the moving average, a special moving averages, 34 EMA wave.
We see the price close above and fail below again, finally the price action can stay above the 34 EMA wave.
The Wave is pointing in one o’clock direction. It is a very strong uptrend. But what goes up will come down. Watch out for the throwback. See the projecting of the possible scenarios of the throwback.
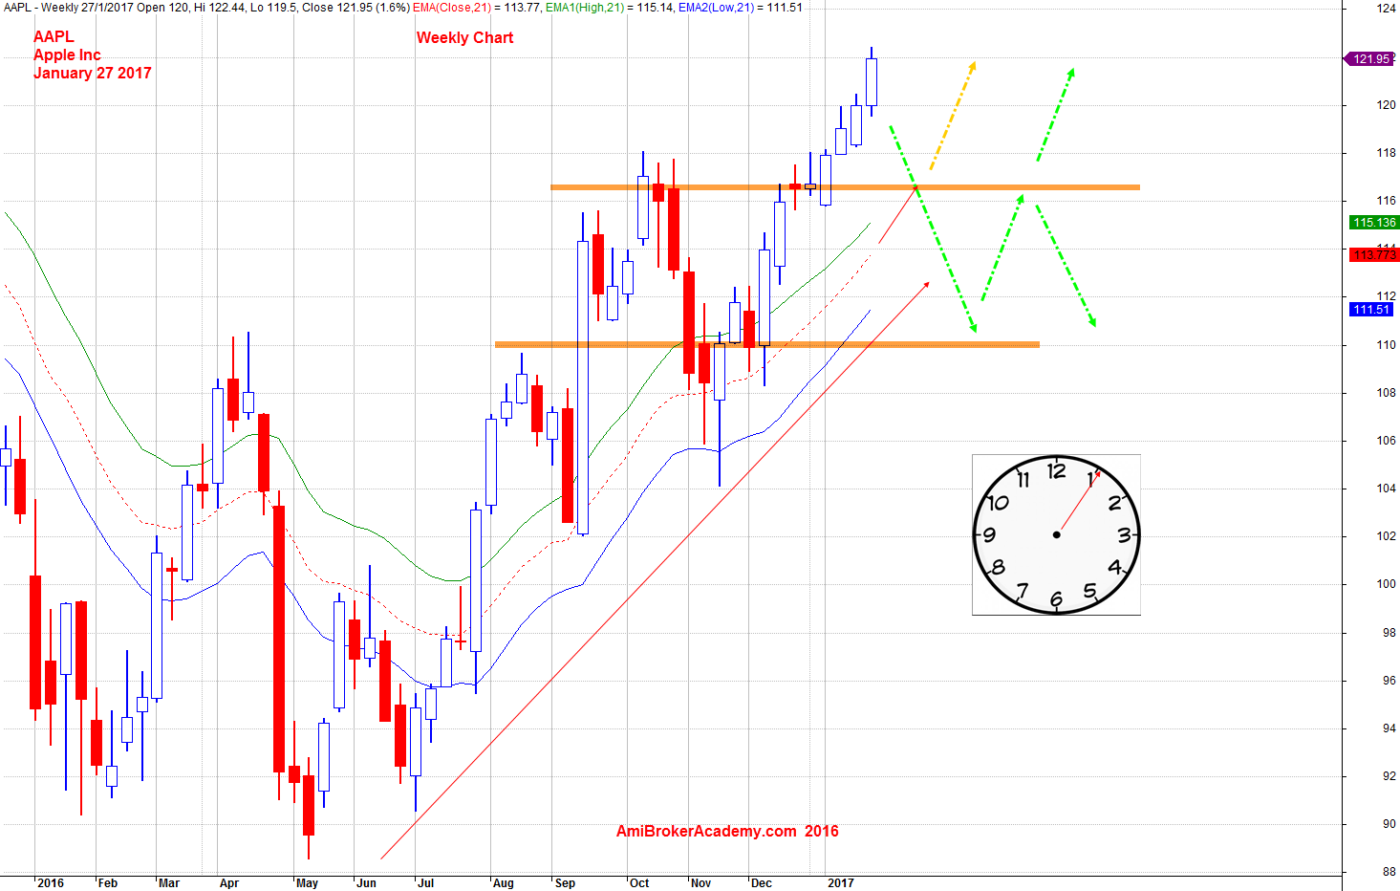
January 27, 2017 Apple Inc and 34 EMA Wave
Apple Inc Weekly and MACD Indicator
ABCD chart pattern is a very easy and simple way to trade, but can you manage your risk rewards (RR).
We see a double bottom and the breakout of neckline and throwback.
In fact, moving average is a great visual tool. We see golden cross, we see price action supported by the 50 MA.
MACD provides clue in this chart. The key level, also the neckline that we drawn is a very important level.
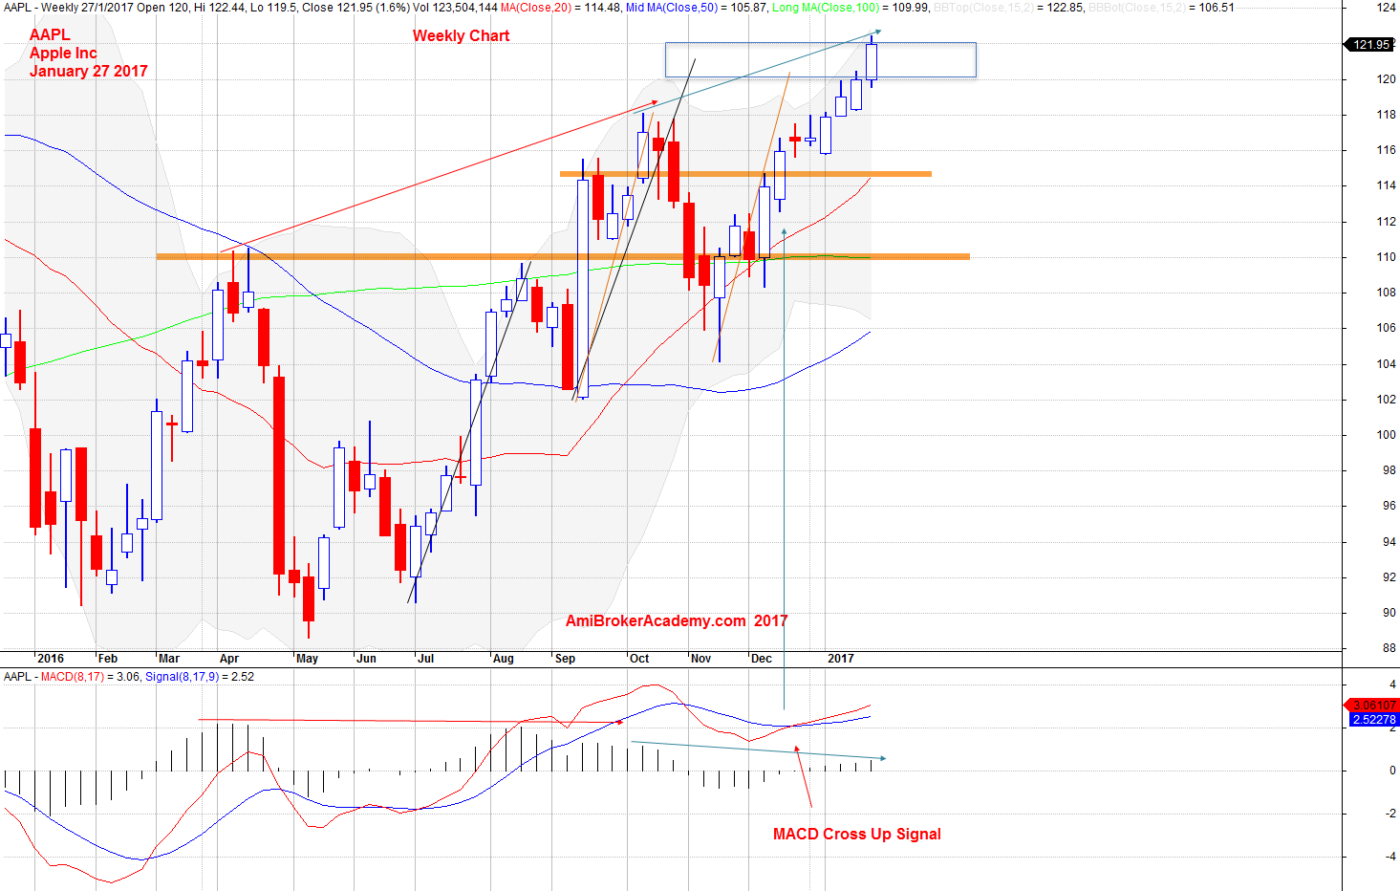
January 27, 2017 Apple Inc Weekly and MACD Indicator
Moses
AmiBrokerAcademy.com
Disclaimer
The above result is for illustration purpose. It is not meant to be used for buy or sell decision. We do not recommend any particular stocks. If particular stocks of such are mentioned, they are meant as demonstration of Amibroker as a powerful charting software and MACD. Amibroker can program to scan the stocks for buy and sell signals.
These are script generated signals. Not all scan results are shown here. The MACD signal should use with price action. Users must understand what MACD and price action are all about before using them. If necessary you should attend a course to learn more on Technical Analysis (TA) and Moving Average Convergence Divergence, MACD.
Once again, the website does not guarantee any results or investment return based on the information and instruction you have read here. It should be used as learning aids only and if you decide to trade real money, all trading decision should be your own.