February 10, 2017
Moses Stock Trading Blog Site – AmiBrokerAcademy.com
Thank you for visiting the amibrokeracademy.com blog site. No one like us doing analysis like what you read here. Let your friends know if you enjoy what you read here.
Welcome to Moses’s US Stock Analysis @ AmiBrokerAcademy.com.
Dow Index is such an important index for US markets, just want to have a few closeup view from different angle.
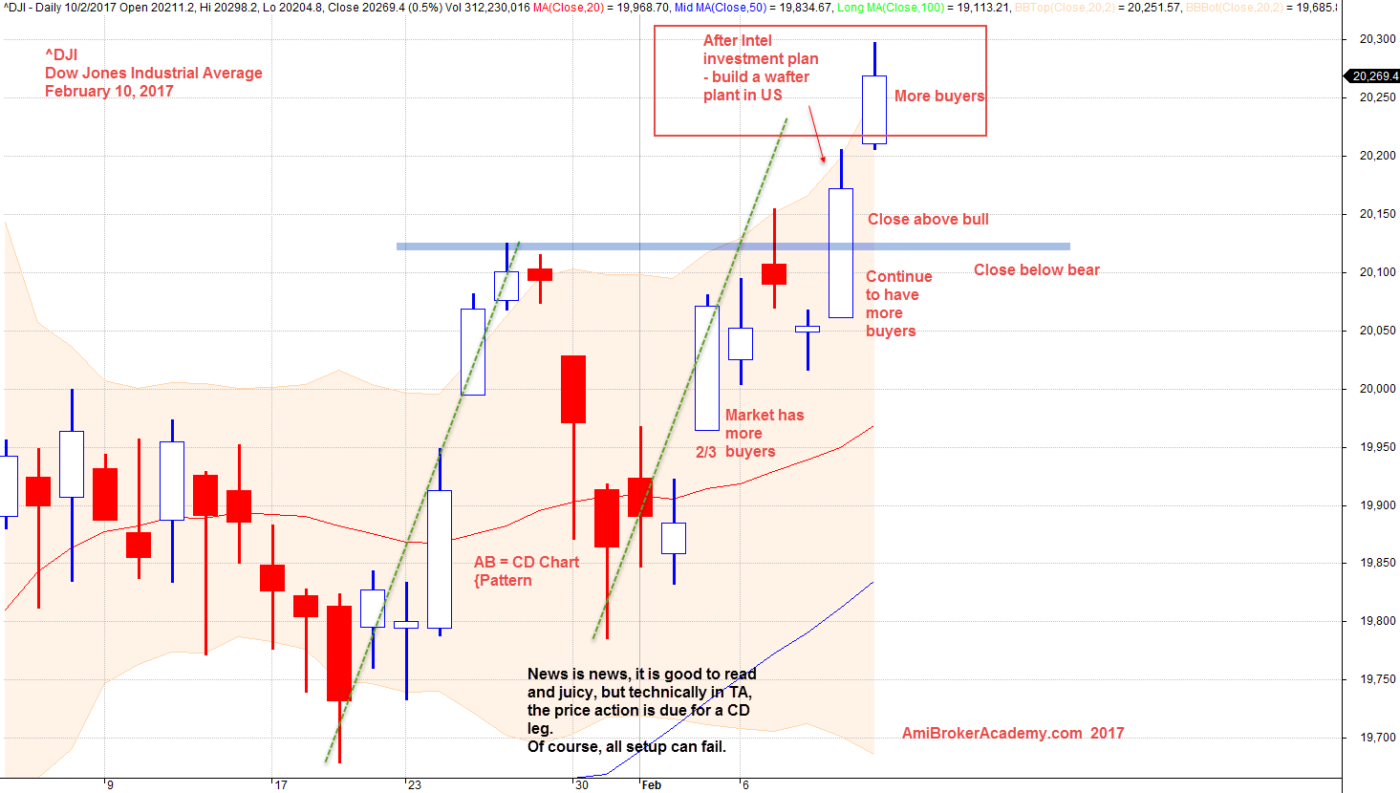
Dow Jones Industrial Average and ABCD Gartley Pattern
All set up can fail, but this is a perfect ABCD chart pattern example. We see the B point a key level for bull or bear point. See chart for more.
We see up, we see down, we see the market react to job reports, we see market react to Intel wafer plant investment plan. What is more? True or true? From a TA stands point, AB = CD chart pattern, the index is due for a higher move. If it does not fail, fail in the AB CD chart pattern setup. the index will be position in where today, February 10 level.
February 10, 2017 Dow Jones Industrial Average and Gartley
Dow Jones Industrial Average and ABCD Gartley Pattern
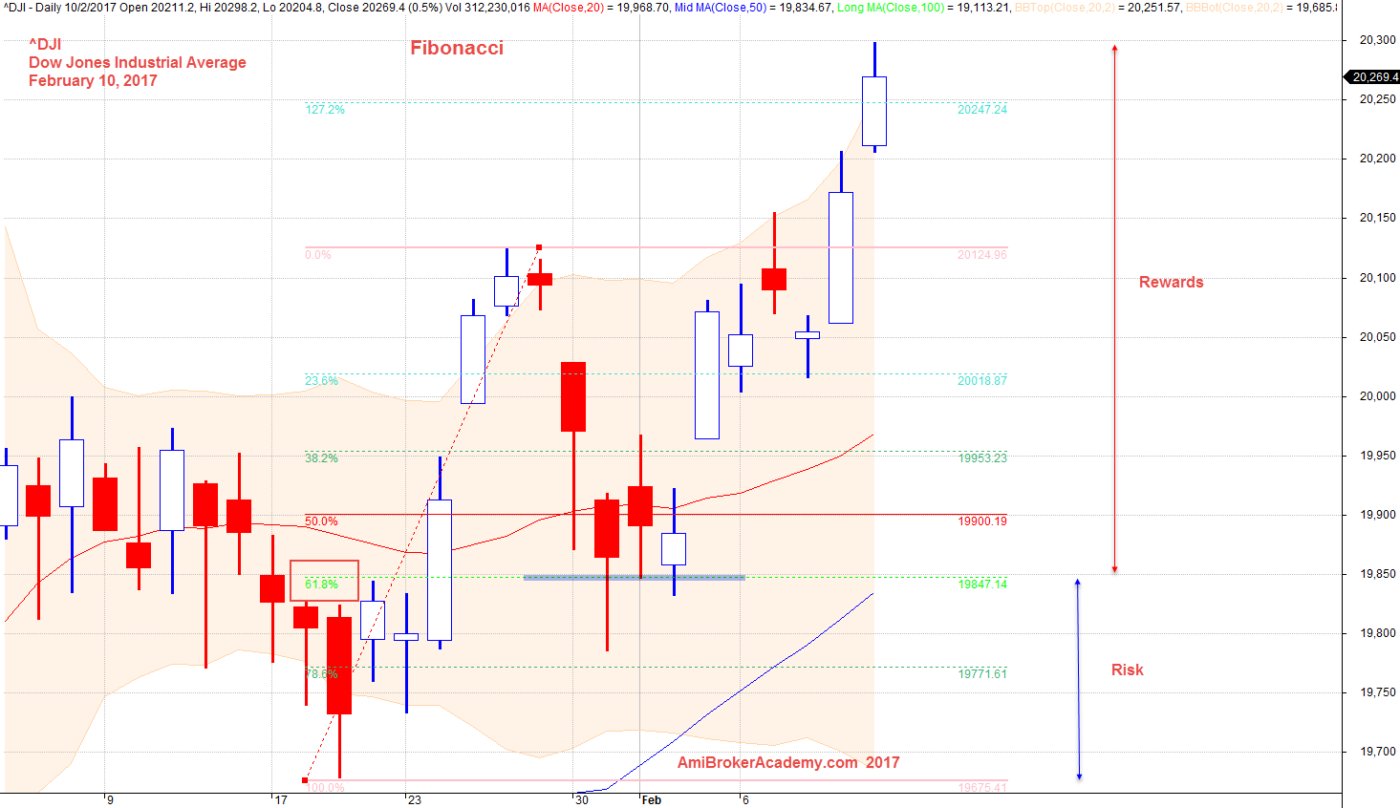
Risk Rewards (RR) is a great reason on review Fibonacci Level for support and resistance. Picture worth a thousand words. See chart for the key level of Fibonacci, such as 61.8%.
February 10, 2017 Dow Jones Industrial Average and Fibonacci
Dow Jones Industrial Average and ABCD Gartley Pattern
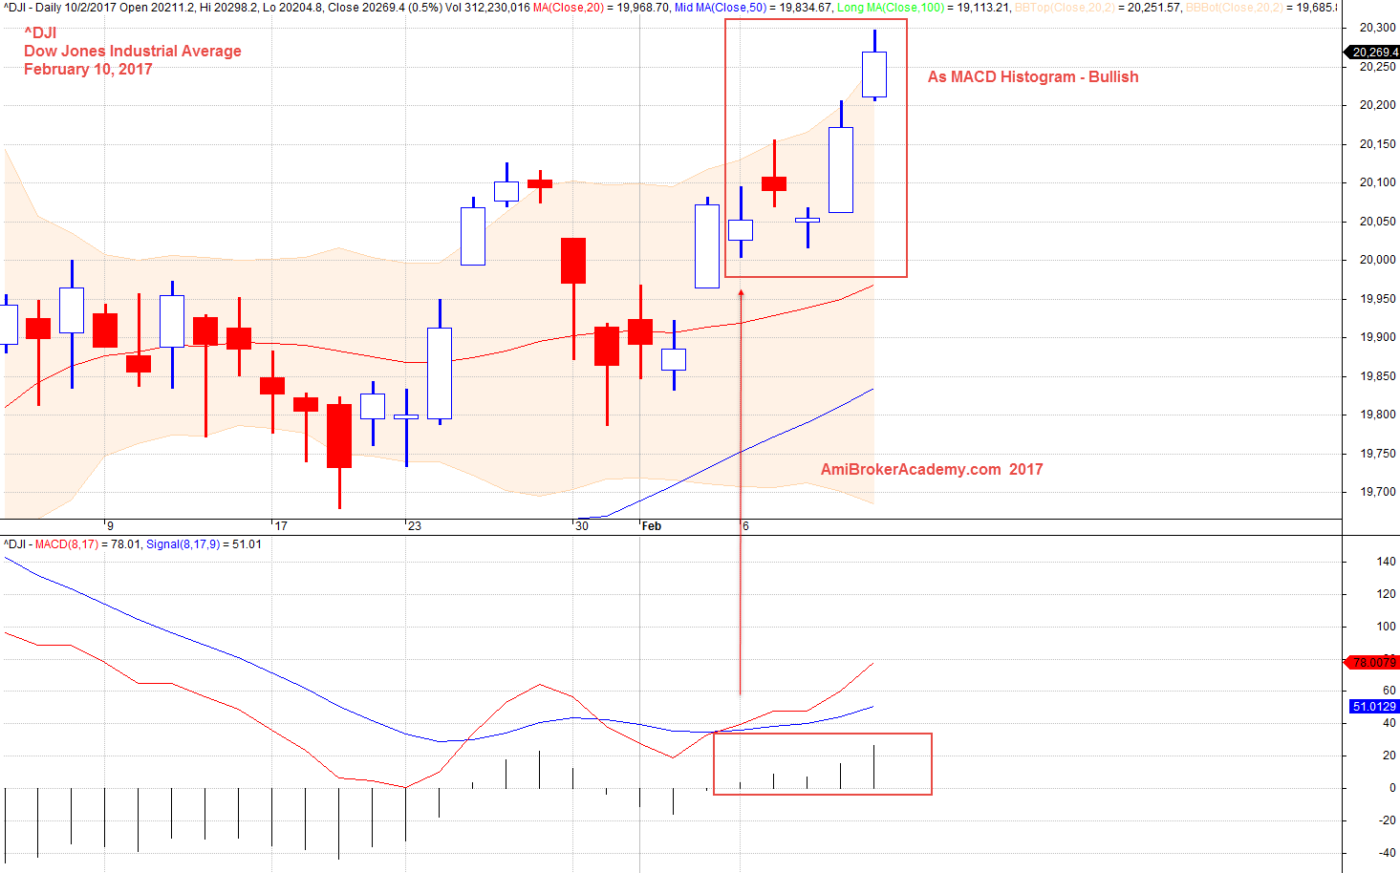
MACD Indicator is a good visual tool for bullish and bearish bias trending. We see MACD Histogram above zeroline; bullish bias. Low risk to buy than sell.
If you have no times for news, indicator such as MACD is a good market sentiment. It can be lacking from some traders viewpoint.
February 10, 2017 Dow Jones Industrial Average and MACD Indicator
Moses
AmiBrokerAcademy.com
Disclaimer
The above result is for illustration purpose. It is not meant to be used for buy or sell decision. We do not recommend any particular stocks. If particular stocks of such are mentioned, they are meant as demonstration of Amibroker as a powerful charting software and MACD. Amibroker can program to scan the stocks for buy and sell signals.
These are script generated signals. Not all scan results are shown here. The MACD signal should use with price action. Users must understand what MACD and price action are all about before using them. If necessary you should attend a course to learn more on Technical Analysis (TA) and Moving Average Convergence Divergence, MACD.
Once again, the website does not guarantee any results or investment return based on the information and instruction you have read here. It should be used as learning aids only and if you decide to trade real money, all trading decision should be your own.