February 10, 2017
Moses Stock Trading Blog Site – AmiBrokerAcademy.com
Thank you for visiting the amibrokeracademy.com blog site. No one like us doing analysis like what you read here.
Welcome to Moses’s US Stock Analysis @ AmiBrokerAcademy.com.
Trade what you see.
The volatility index, ^VIX is now in a low, and all time low. VIX has a big drop since November, it goes from 22 to 11. A big 10 points drop.
Is it no one has any fea? Is it that no one has any fear that the market will move further higher. May be in short term only. If low is sold, high is buy. Will you think currently is sold and may be oversold.
^VIX Volatility Index
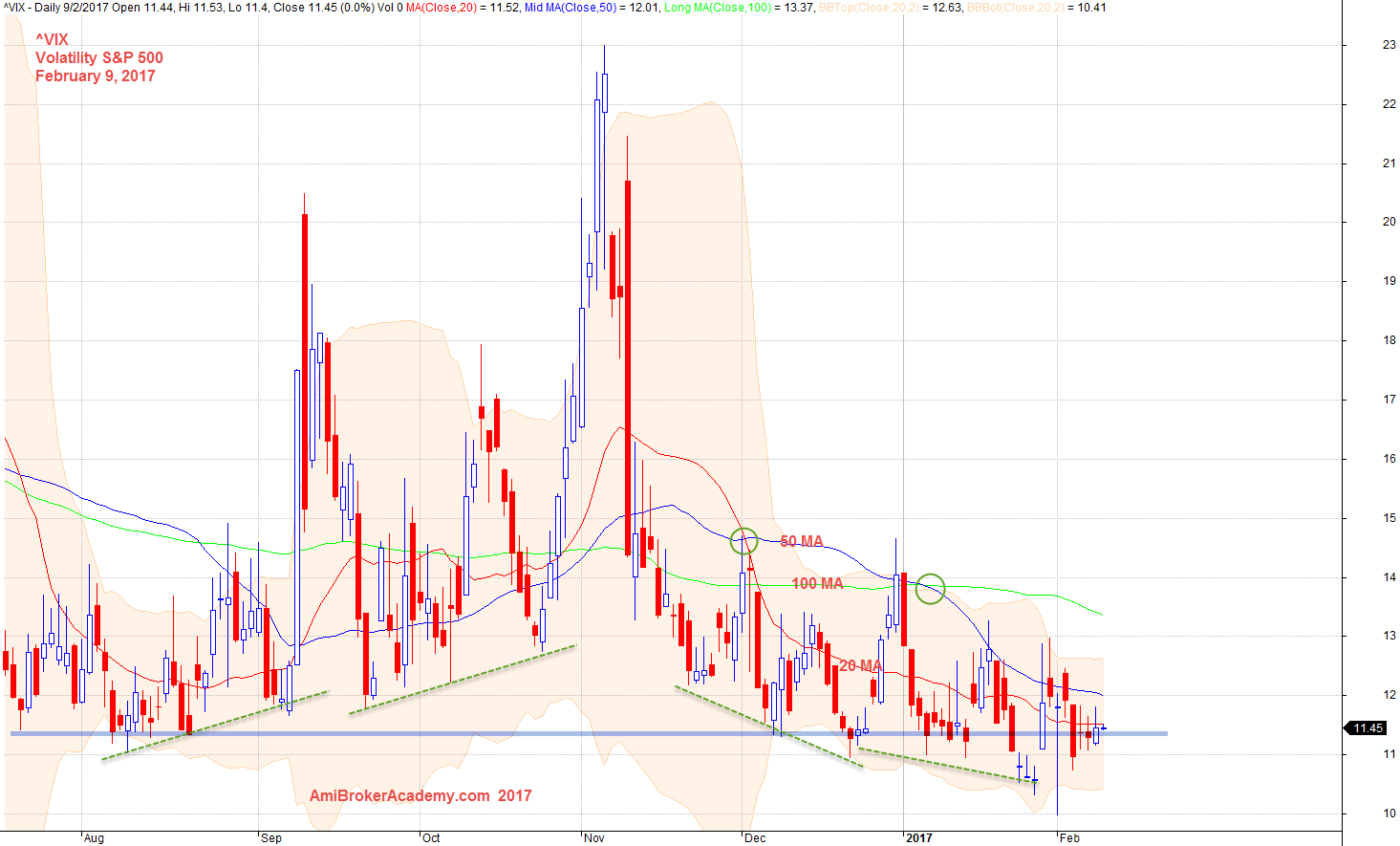
February 9, 2017 Volatility Index and Trendlines
^VIX Volatility Index and MACD Indicator
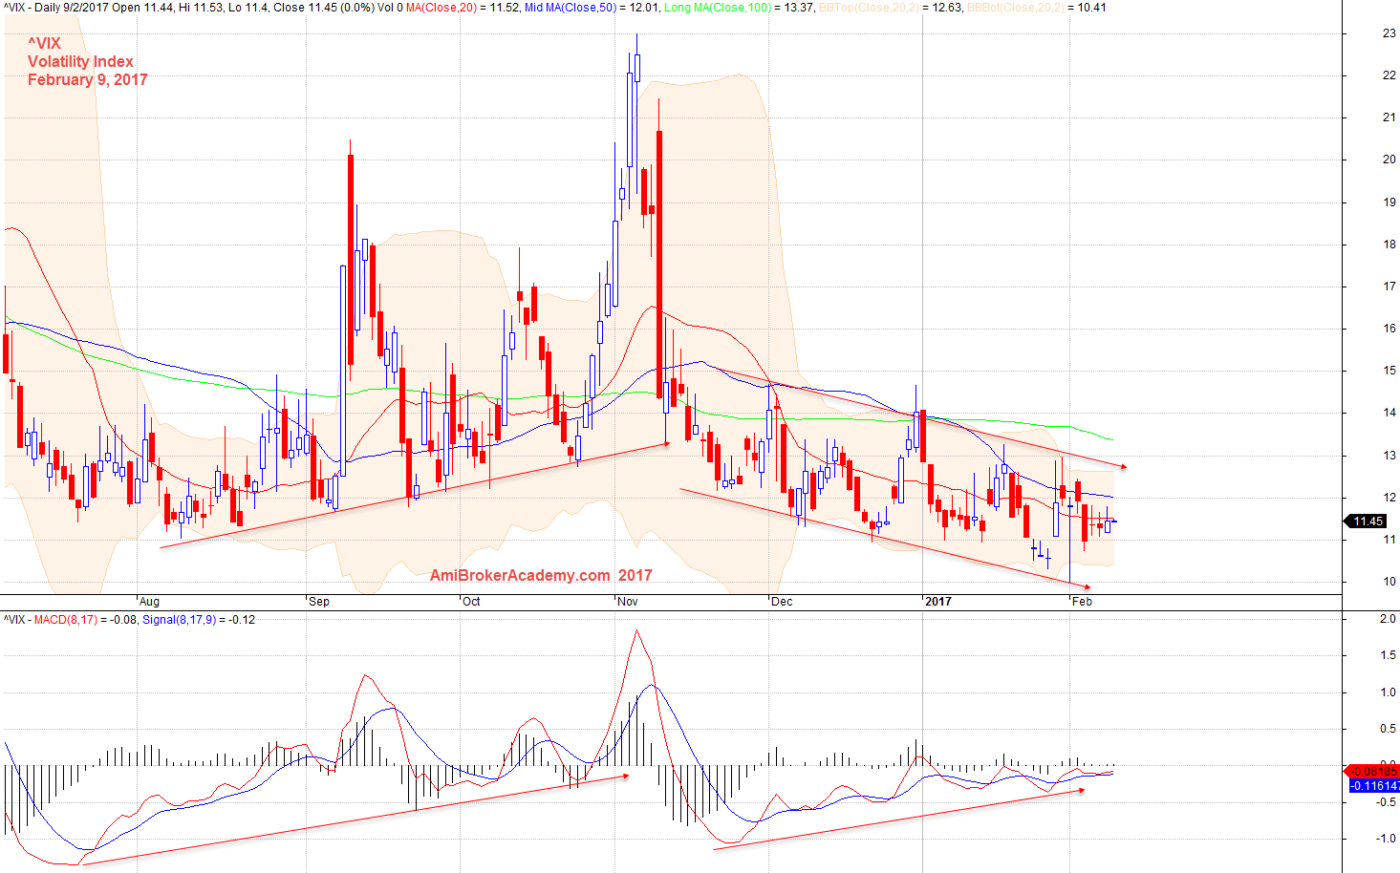
February 9, 2017 Volatity Index and MACD
^VIX Volatility Index and Gartley Pattern
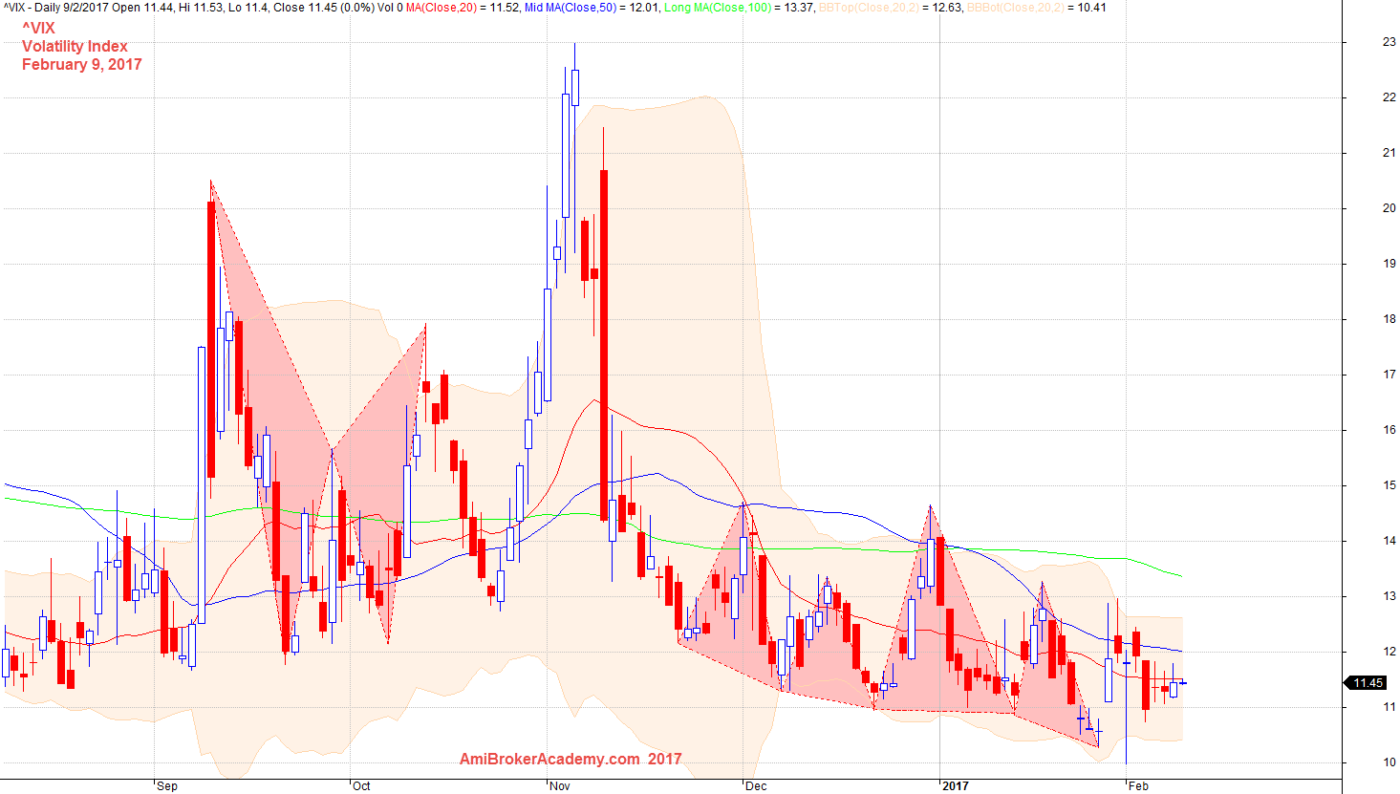
February 9, 2017 Volatility Index and Gartley Pattern
Moses
AmiBrokerAcademy.com
Disclaimer
The above result is for illustration purpose. It is not meant to be used for buy or sell decision. We do not recommend any particular stocks. If particular stocks of such are mentioned, they are meant as demonstration of Amibroker as a powerful charting software and MACD. Amibroker can program to scan the stocks for buy and sell signals.
These are script generated signals. Not all scan results are shown here. The MACD signal should use with price action. Users must understand what MACD and price action are all about before using them. If necessary you should attend a course to learn more on Technical Analysis (TA) and Moving Average Convergence Divergence, MACD.
Once again, the website does not guarantee any results or investment return based on the information and instruction you have read here. It should be used as learning aids only and if you decide to trade real money, all trading decision should be your own.