September 18, 2017
Second to Support and Resistance as bread and butter for both novice and seasoned traders and investors, MACD may be considered a great visual tool for chart analysis.
BABA Alibaba Group Holding Weekly Chart and MACD
Picture worth a thousand words, see the analysis on the chart.
MACD (Moving Average Convergence Divergence)
MACD is a relationship between two moving averages. It is a measure of momentum in the price action. When the moving average move further apart, this is a sign of increase momentum.
MACD can be used as a trend indicator or a measure of price is overbought or oversold.
Here’s an example of Alibaba Group Holding which we see number of MACD signals. See chart for more, as picture worth a thousand words.
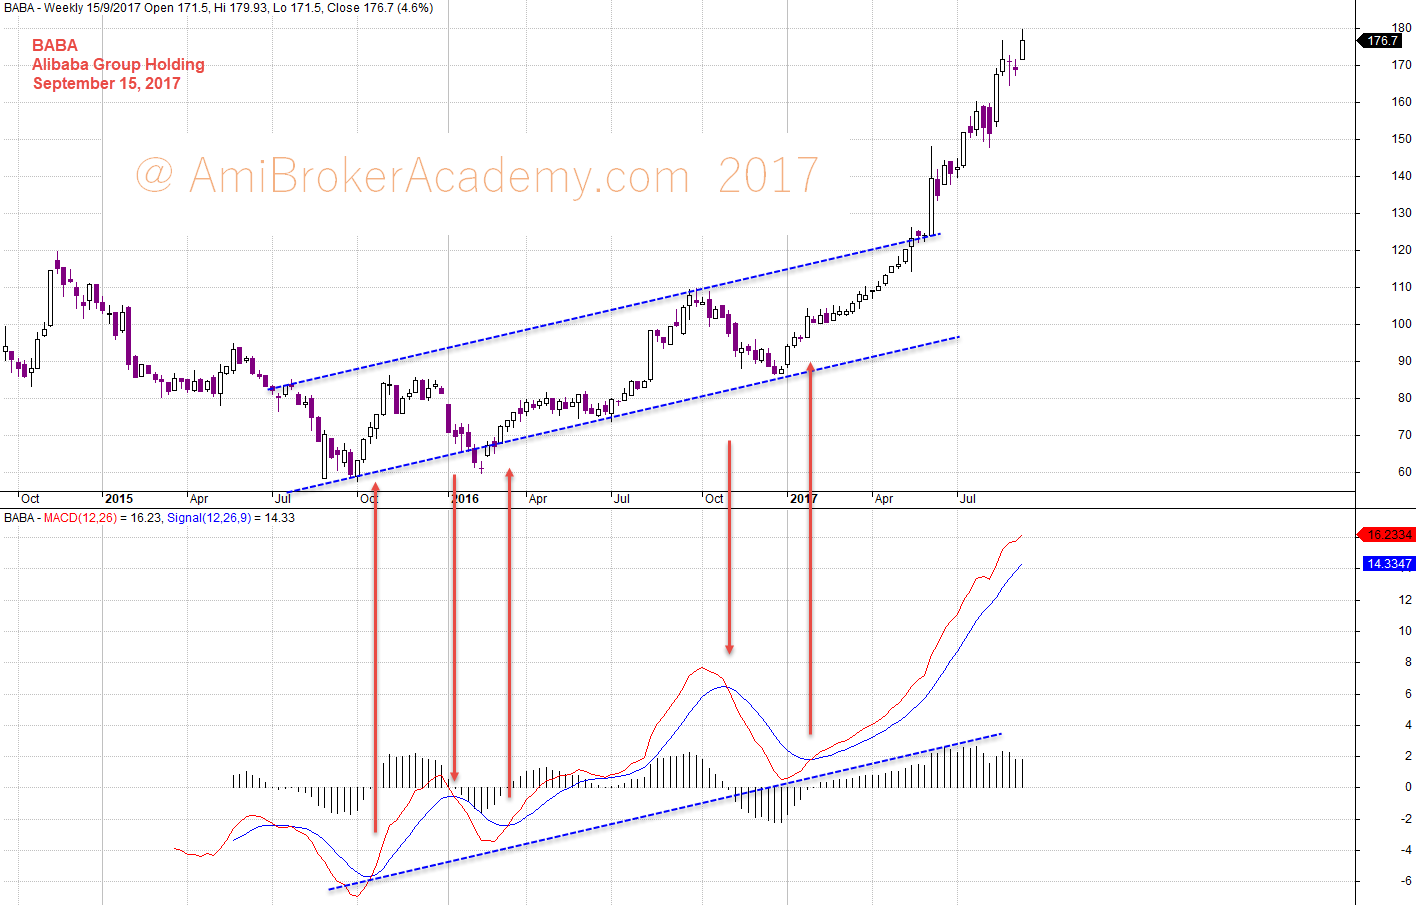
September 15, 2017 Alibaba Group Holding and MACD Signals
Thanks for visit the site here. You could also find free MACD scan here in this site too.
Moses
AmiBrokerAcademy.com
Disclaimer
The above result is for illustration purpose. It is not meant to be used for buy or sell decision. We do not recommend any particular stocks. If particular stocks of such are mentioned, they are meant as demonstration of Amibroker as a powerful charting software and MACD. Amibroker can program to scan the stocks for buy and sell signals.
These are script generated signals. Not all scan results are shown here. The MACD signal should use with price action. Users must understand what MACD and price action are all about before using them. If necessary you should attend a course to learn more on Technical Analysis (TA) and Moving Average Convergence Divergence, MACD.
Once again, the website does not guarantee any results or investment return based on the information and instruction you have read here. It should be used as learning aids only and if you decide to trade real money, all trading decision should be your own.