September 18, 2017
BABA Alibaba Group Holding Weekly Chart and Support Resistance
Picture worth a thousand words, see the analysis on the chart.
Support Resistance
Support and Resistance are bread and butter for both novice and seasoned traders and investors.
Support is like a “floor” the price fall no further. It typically created by the previous high or low. When the price breakout below the support, we can see it as weakness with further falls likely to continue.
Resistance is like a “ceiling” the price can not go any further higher. It typically created by the previous high or low. When the price breakout higher than the resistance, we see it as strength with further rises likely to follow.
Support Resistance levels can also be found using the following techniques Fibonacci, Elliott Wave Theory, and Gann. Fibonacci, Elliott Wave, ad Gann are derived by relied on the natural number sequences and various ratio.
So, in short Support Resistance can be formed by simple horizontal lines extended from their previous highs or lows, to complex algorithms based on advanced mathematics calculation.
Here’s an example of Alibaba Group Holding which forms number of support resistance. See chart for more, as picture worth a thousand words.
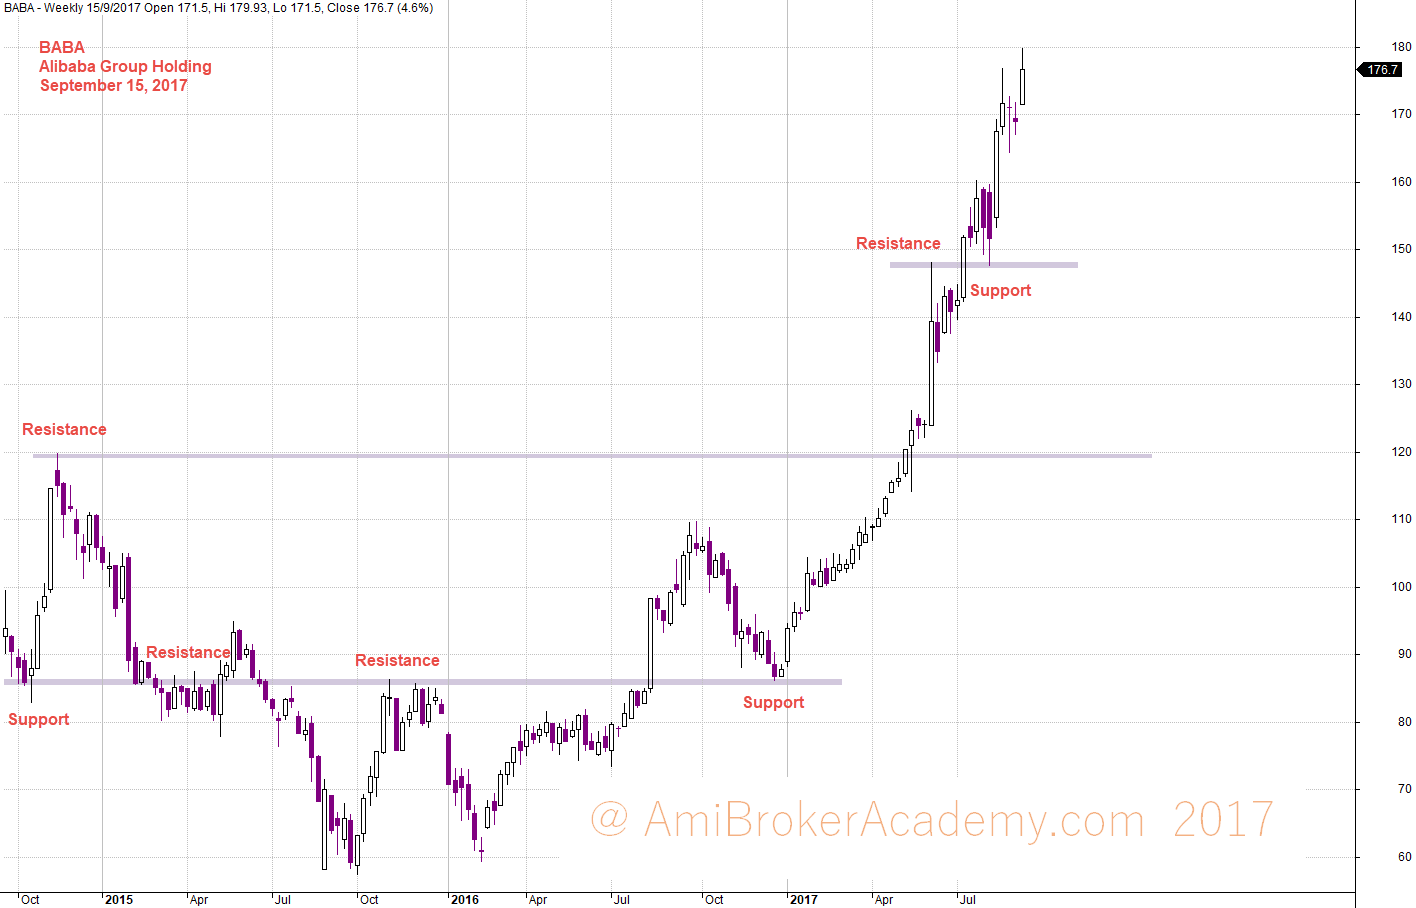
September 15, 2017 Alibaba Group Holding Weekly Chart and Support Resistance
Thanks for visit the site here. You could also find free MACD scan here in this site too.
Moses
AmiBrokerAcademy.com
Disclaimer
The above result is for illustration purpose. It is not meant to be used for buy or sell decision. We do not recommend any particular stocks. If particular stocks of such are mentioned, they are meant as demonstration of Amibroker as a powerful charting software and MACD. Amibroker can program to scan the stocks for buy and sell signals.
These are script generated signals. Not all scan results are shown here. The MACD signal should use with price action. Users must understand what MACD and price action are all about before using them. If necessary you should attend a course to learn more on Technical Analysis (TA) and Moving Average Convergence Divergence, MACD.
Once again, the website does not guarantee any results or investment return based on the information and instruction you have read here. It should be used as learning aids only and if you decide to trade real money, all trading decision should be your own.