July 1, 2017
Half-year Results | Completed Half Mark 2017 | DBS Group Holdings
DBS, Singapore listed Stock.
Picture worth a thousand words. Trend is still slopping up. The channel slopping from bottom left to top right.
Compare to OCBC, UOB stock, the trend look similar.
We see the price action breakout from the lower channel to next channel level. This is the half year 2017 DBS stock price performance. Do not miss understand this is Singapore economic? Take it easy.
An inside bar, the trend is ranging.
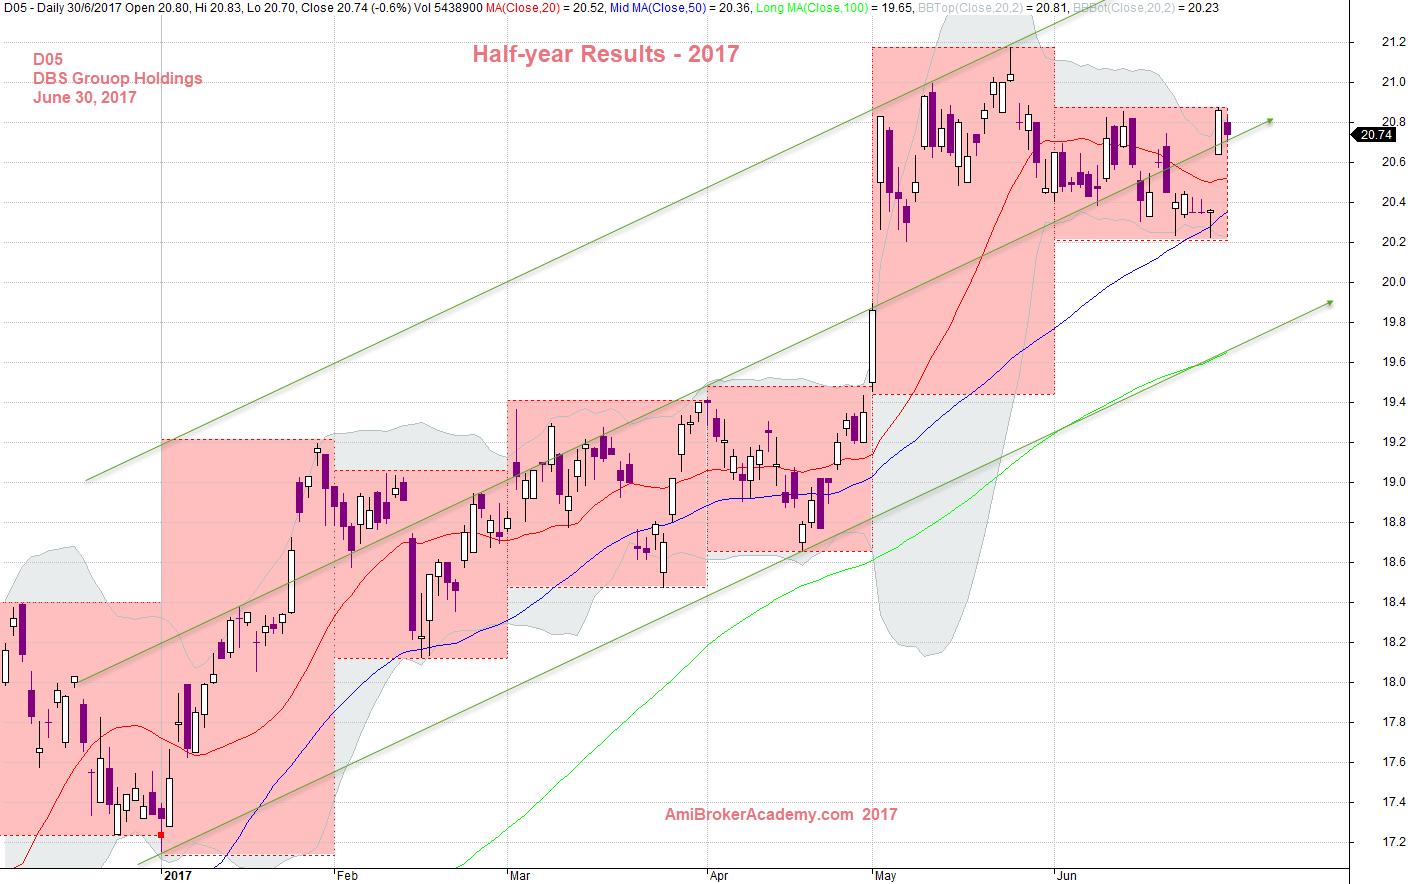
June 30, 2017 DBS Group Holdings Half-year Stock Performance
D05 | DBS | DBS Group Holdings and MACD Signals
MACD may has a cross up signal.
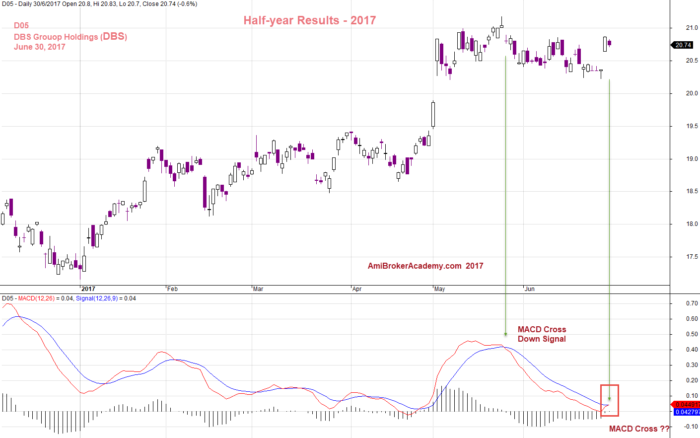
June 30, 2017 DBS Group Holding and MACD Signals
When you analyse one bank in Singapore market, you must also check out the other two major local bank, UOB, and OCBC.
Moses Stock Analysis
AmiBrokerAcademy.com
Disclaimer
The above result is for illustration purpose. It is not meant to be used for buy or sell decision. We do not recommend any particular stocks. If particular stocks of such are mentioned, they are meant as demonstration of Amibroker as a powerful charting software and MACD. Amibroker can program to scan the stocks for buy and sell signals.
These are script generated signals. Not all scan results are shown here. The MACD signal should use with price action. Users must understand what MACD and price action are all about before using them. If necessary you should attend a course to learn more on Technical Analysis (TA) and Moving Average Convergence Divergence, MACD.
Once again, the website does not guarantee any results or investment return based on the information and instruction you have read here. It should be used as learning aids only and if you decide to trade real money, all trading decision should be your own.