August 1, 2017
E5H Golden Agri Resources and 34 MA Band
See chart for more, picture worth a thousand words.
How to trade this stock? Just in one year, the stock price cross up from below 34 MA band to above 34 MA band. 34 MA slopping from bottom to top, bullish trend. But the share price crosses below the 34 MA band and get resisted by the 34 MA band. Now the price action starts to cross up and stay above the 34 MA band.
To trade this stock, E5H just buy when the price action is above and supported by the 34 MA, of course it is lesser risk when the 34 MA band is slopping up. Taking profit when the price action crosses below 34 MA band and get resisted by 34 MA band.
34 MA Band
Check the 34 MA Band direction, between one and two o’clock. Bullish.
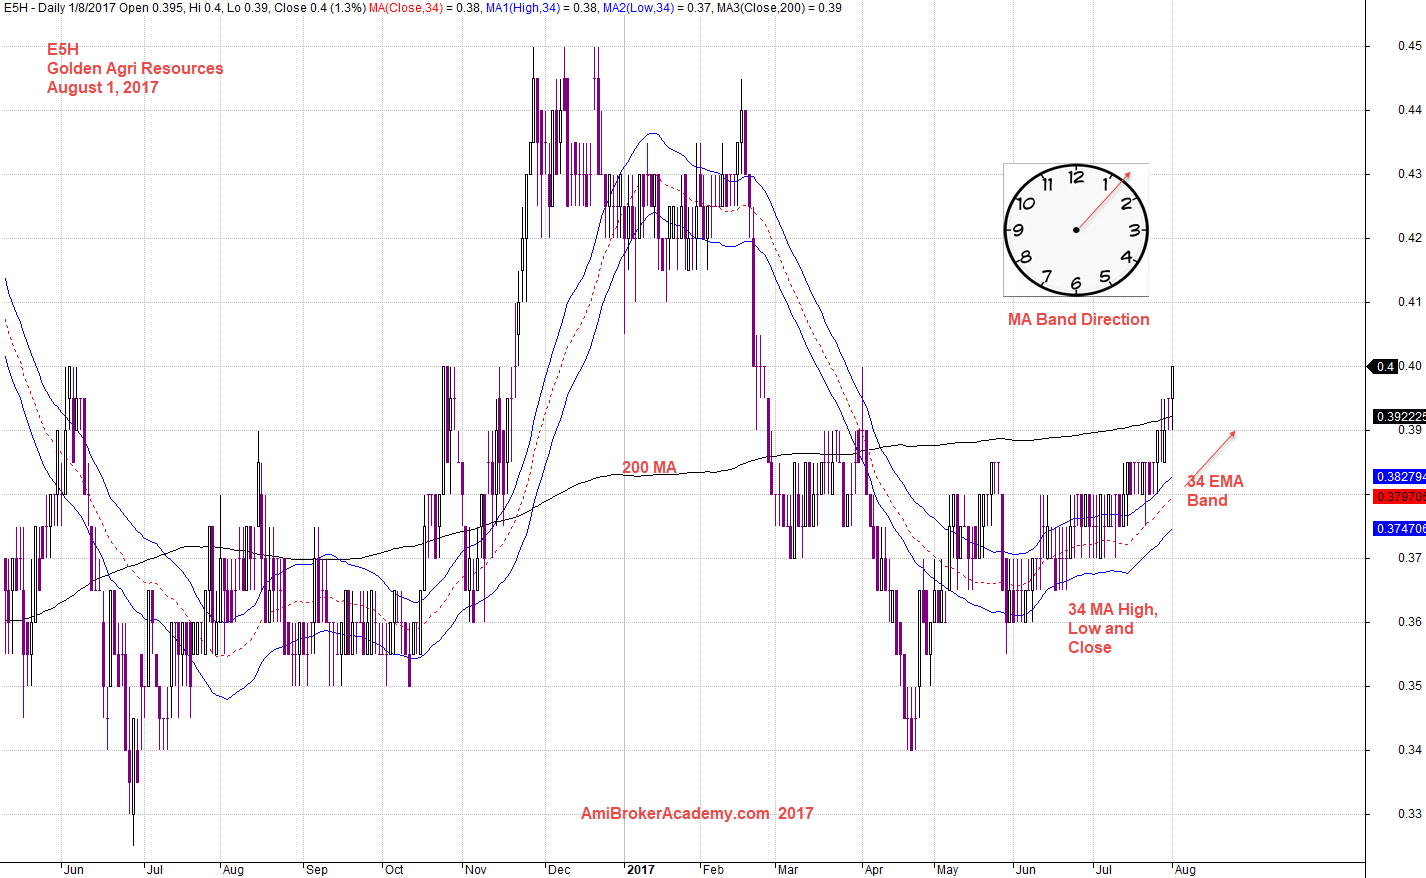
August 1, 2017 Golden Agri Resources and 34 MA Band
E5H and MACD Indicator
Share price after pullback, it begins to bounce up. See ABCD chart pattern. Share price now retest the high. Check out the MACD indicator, MACD has crosses above zeroline, bullish bias. Now the MACD is above zeroline. …
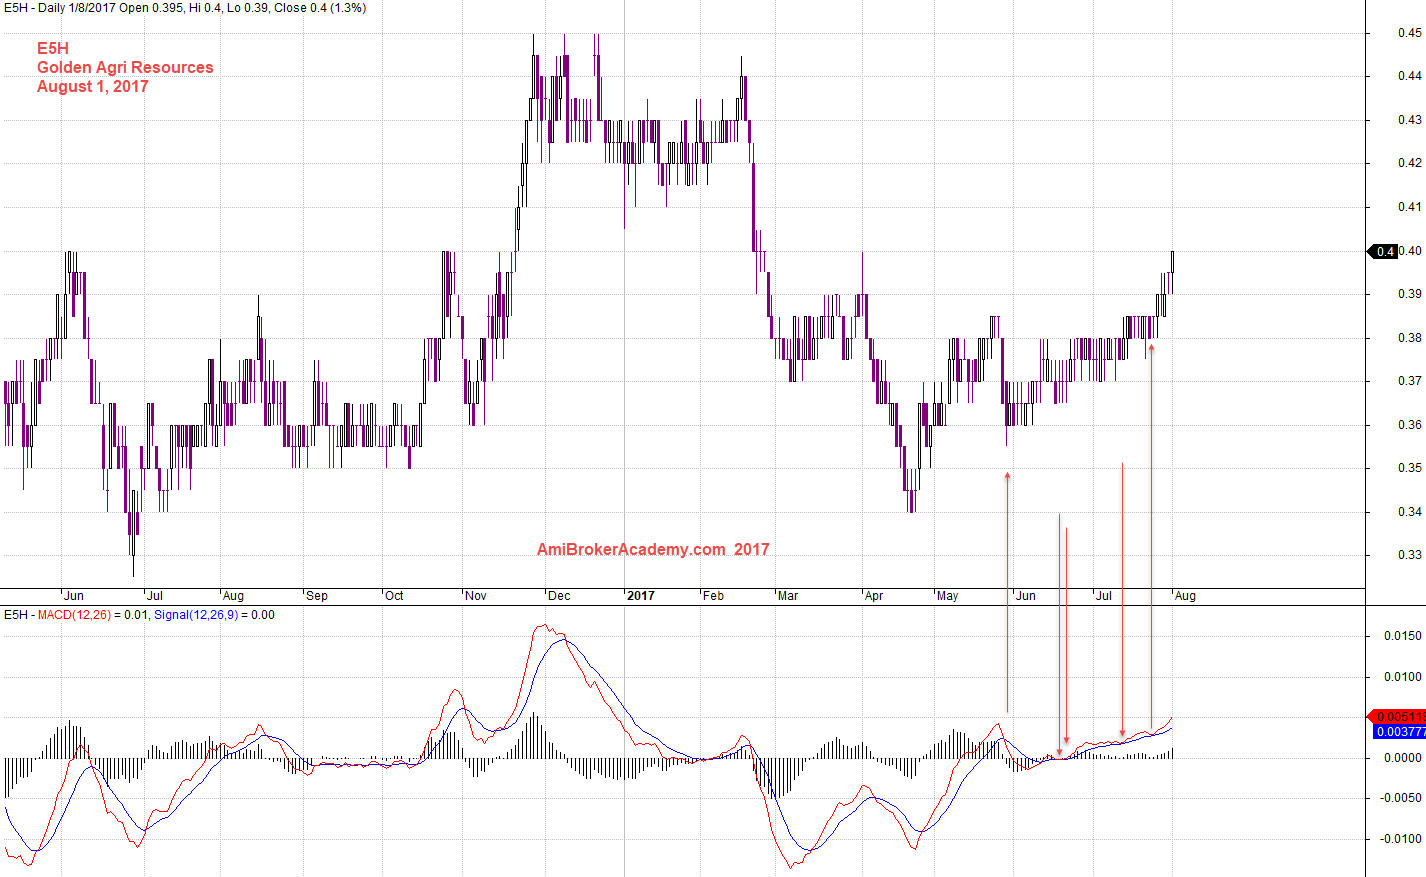
August 1, 2017 Golden Agri Resources and MACD Signals
E5H and Gartley ABCD Chart Pattern
See Gartley ABCD chart pattern. Share price now retest the high. The extension may continue to go higher, but it may be retrace down first.
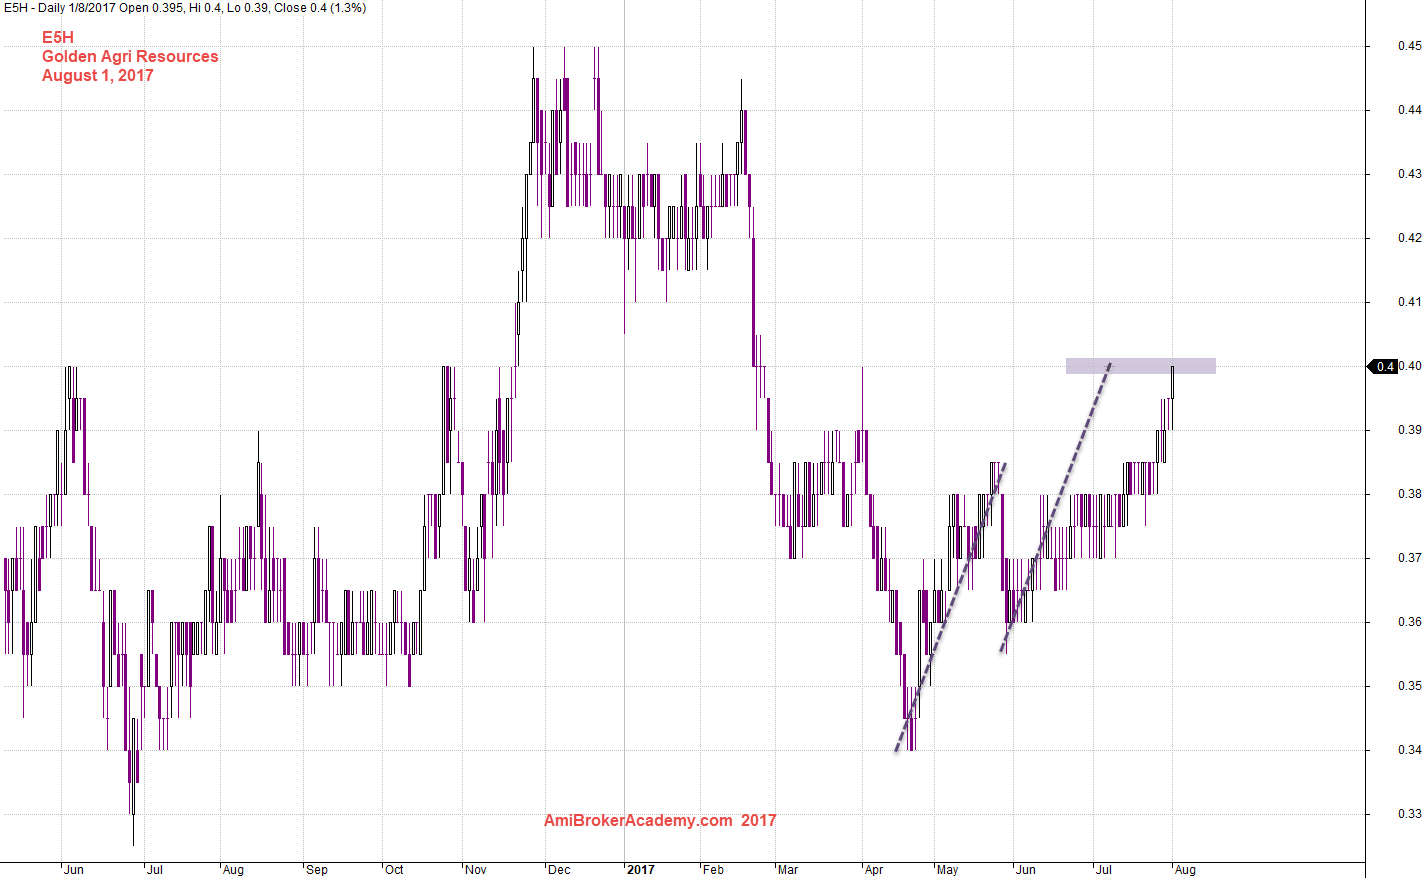
August 1, 2017 Golden Agri Resources and Gartley ABCD Chart Pattern
Remember, trading is all probability.
Moses
AmiBrokerAcademy.com
Disclaimer
The above result is for illustration purpose. It is not meant to be used for buy or sell decision. We do not recommend any particular stocks. If particular stocks of such are mentioned, they are meant as demonstration of Amibroker as a powerful charting software and MACD. Amibroker can program to scan the stocks for buy and sell signals.
These are script generated signals. Not all scan results are shown here. The MACD signal should use with price action. Users must understand what MACD and price action are all about before using them. If necessary you should attend a course to learn more on Technical Analysis (TA) and Moving Average Convergence Divergence, MACD.
Once again, the website does not guarantee any results or investment return based on the information and instruction you have read here. It should be used as learning aids only and if you decide to trade real money, all trading decision should be your own.