August 1, 2017
F03 Food Empire Holdings and 34 MA Band
See chart for more, picture worth a thousand words.
Big picture, the share price moves from bottom left to top right, the 200 MA is slopping up. Bullish.
However, look closer, you see a different picture. The price action has cross below 34 MA band. 34 MA Band has slopped down, the band direction is now at four o’clock. Bearish.
So, the PA has change from bullish to bearish.
34 MA Band
Check the 34 MA Band direction, at four o’clock. Bearish.
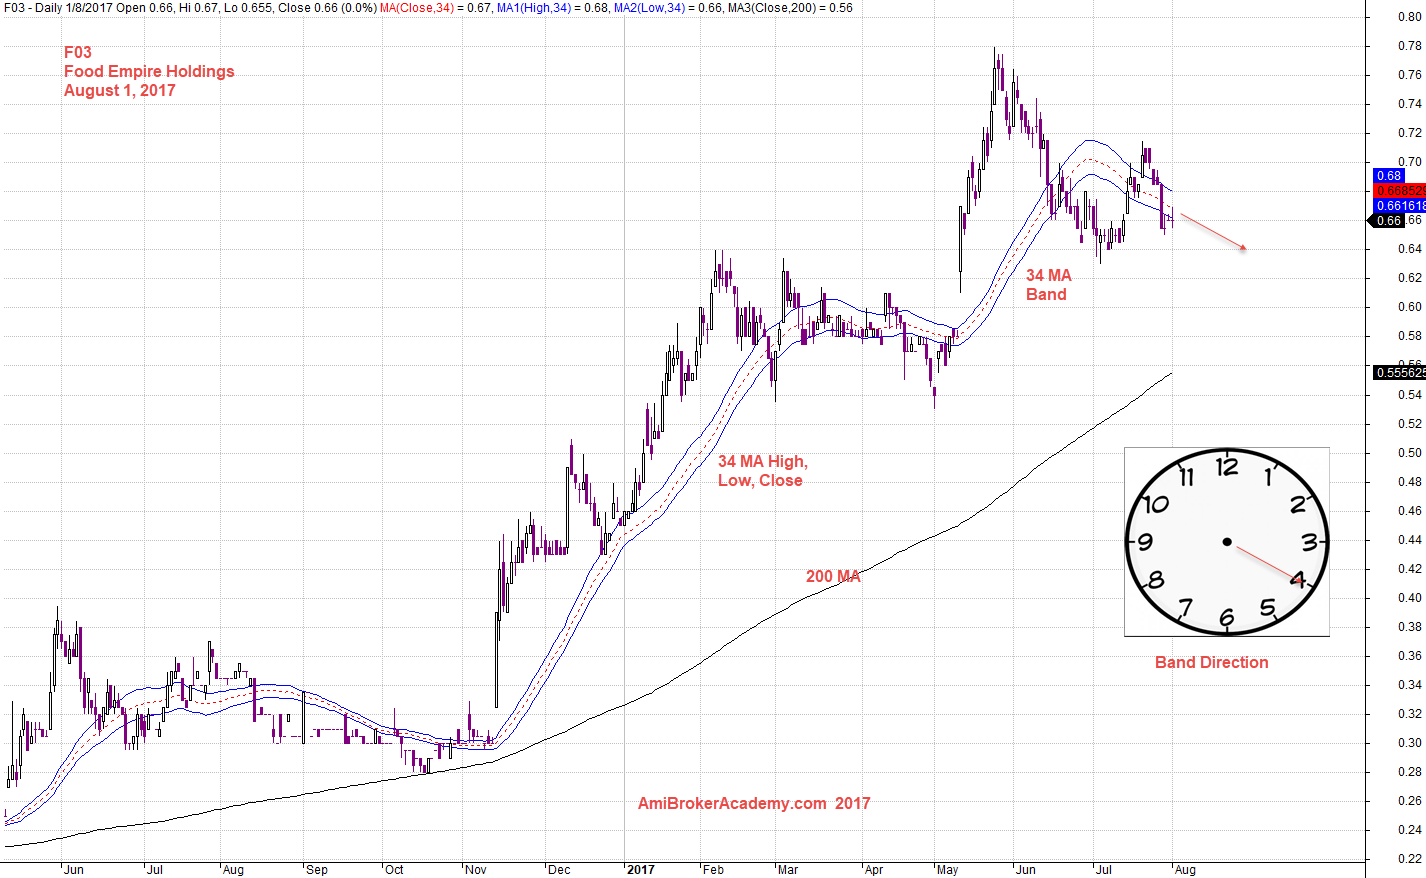
August 1, 2017 Food Empire Holdings and 34 MA Band
F03 and MACD Indicator
Share price has pullback. Share price test the high, or resistance turns support. Check out the MACD indicator, MACD has crossed below zeroline and crossed back up again. Now the MACD is near zeroline line. …
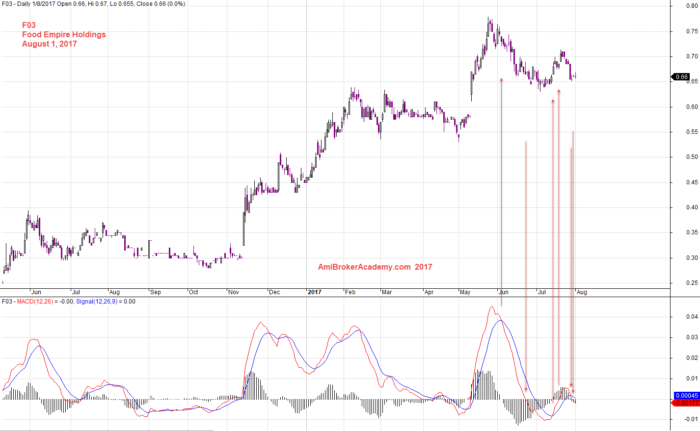
August 1, 2017 Food Empire Holdings and MACD Indicator
Remember, trading is all probability.
Moses
AmiBrokerAcademy.com
Disclaimer
The above result is for illustration purpose. It is not meant to be used for buy or sell decision. We do not recommend any particular stocks. If particular stocks of such are mentioned, they are meant as demonstration of Amibroker as a powerful charting software and MACD. Amibroker can program to scan the stocks for buy and sell signals.
These are script generated signals. Not all scan results are shown here. The MACD signal should use with price action. Users must understand what MACD and price action are all about before using them. If necessary you should attend a course to learn more on Technical Analysis (TA) and Moving Average Convergence Divergence, MACD.
Once again, the website does not guarantee any results or investment return based on the information and instruction you have read here. It should be used as learning aids only and if you decide to trade real money, all trading decision should be your own.