April 26, 2019
Thanks for visit the site here. Hope you find the read interesting.
Think think got more things.
If you are new here, do not believe in everything you read here. As many of the example are not for beginner. Only the experience trader could appreciate why we see thing in the way we see. Be careful. Manage your own risk. All setup can fail. Remember, trading is no different from running a business. Hope you know what we mean.
Have fun!
Oh! Yes! Please read thing in full and do not jump the gun to get any conclusion! All the illustration here is just examples.
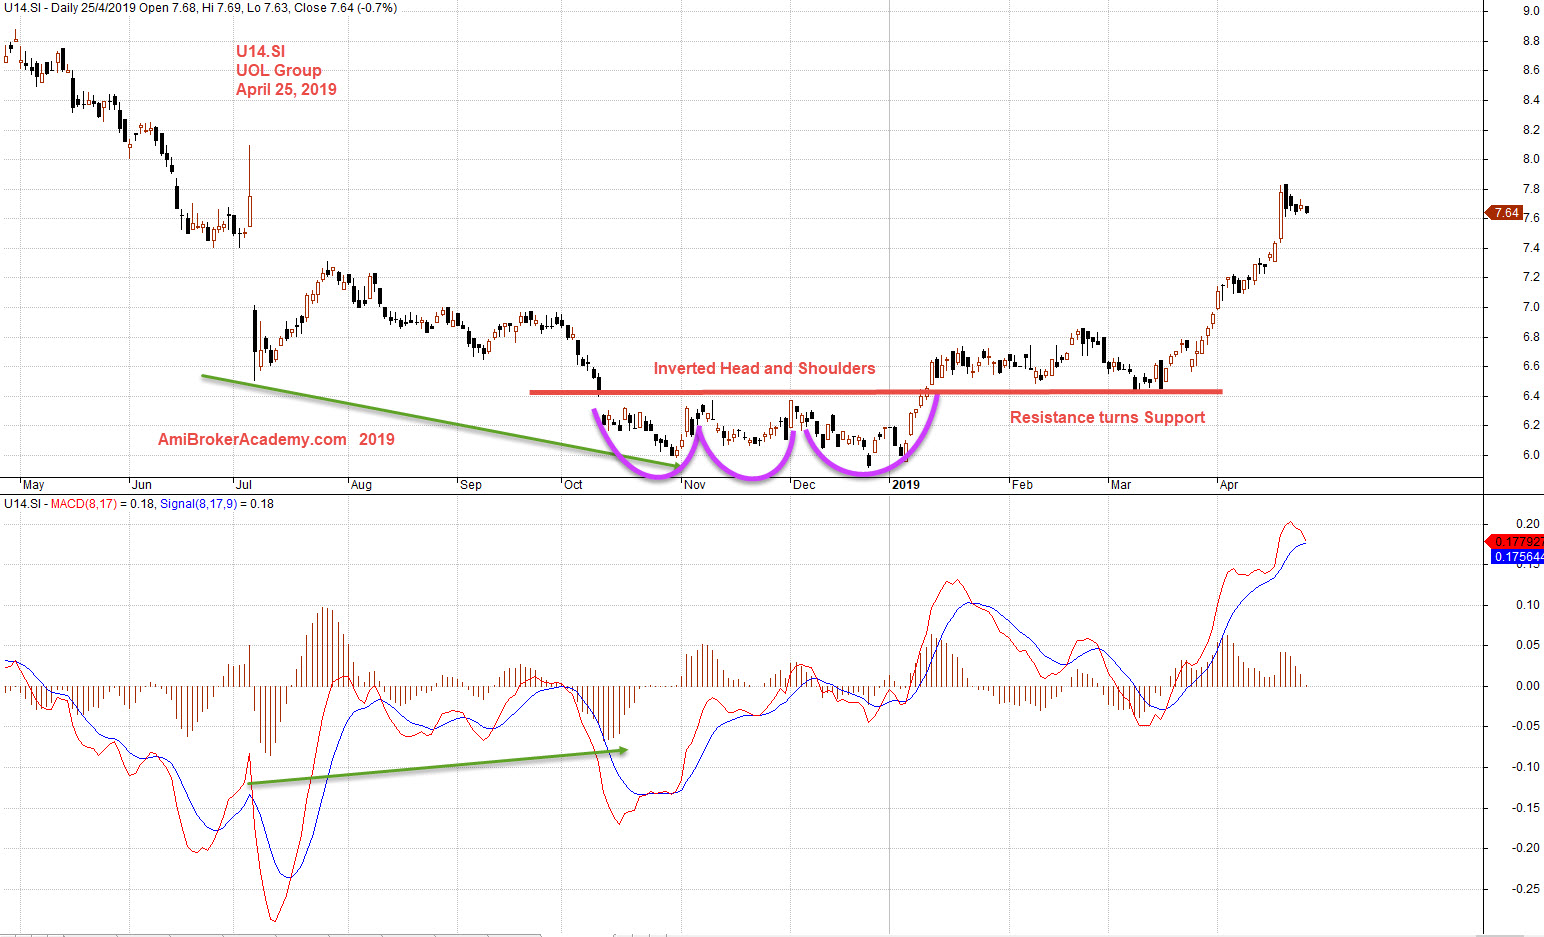
U14.SI UOL Group Stock Charting
Zoom in, study UOL Group Stock chart and chart pattern – Inverted Head and Shoulders.
See chart, picture worth a thousand words.
How to trade UOL Group stock? An inverted head and shoulders over ten months. Truly, not easy. But stock to buy a hold a stock for ten months, it is nothing. There are people apply buy and hold strategy, hold stock or stocks for more than ten years. But, I have to say, it is very risky. There are many buy hold success and failure story posting on the website. You can check them out. Have fun!
We zoom in and add MACD indicator. MACD indicator is leading indicator. MACD reports the possibility of trend change.
Many may feedback and say MACD is not accurate. Friend, I believe to take transport like car or bus. Do you stop at every traffic light? No, right I believe. Of course, you may I should say. Traffic light is design to manage for change of traffic direction. So, traffic light signal to stop for a change in traffic flow. But, you don’t stop at every traffic light. So this is MACD too, MACD signal you there is a change of trend, but sometime the trend continue and did not change.
In the following example, see the price action continue to go lower, and MACD divergence happen, positive MACD divergence. Signal there is a possible of reversal. Price Action responded an inverted head and shoulders. Neckline become support, price action take off and move north.
Trade with eyes open.
We did a UOL Group stock charting on a big picture, also an inverted head and shoulders. Check out our previous posting for more. Over Ten Months | Inverted Head and Shoulders | U14.SI UOL Group Moses Stock Charting | AmiBrokerAcademy.com. Have fun!
Moses Stock Chart Analysis
AmiBrokerAcademy.com
Disclaimer
The above result is for illustration purpose. It is not meant to be used for buy or sell decision. We do not recommend any particular stocks. If particular stocks of such are mentioned, they are meant as demonstration of Amibroker as a powerful charting software and MACD. Amibroker can program to scan the stocks for buy and sell signals.
These are script generated signals. Not all scan results are shown here. The MACD signal should use with price action. Users must understand what MACD and price action are all about before using them. If necessary you should attend a course to learn more on Technical Analysis (TA) and Moving Average Convergence Divergence, MACD.
Once again, the website does not guarantee any results or investment return based on the information and instruction you have read here. It should be used as learning aids only and if you decide to trade real money, all trading decision should be your own.