June 24, 2018
Singapore Stock Stories
Z50 Yoma Strategic Holdings Stock Charting
See chart, picture worth a thousand words. Study Yoma Strategic Holdings stock price charting. Yoma Strategic Holdings after tested the peak 67 cents in 2017 the price action went to low at 48 cents in 2017. The stock price action pullback of 2018 high at 55 cents. Since then the price action begin to drift south. The stock price finally reach the low of 38 cents. The price action has no sign of rebounce. It is not a good idea to catch the falling knife at this point. There is no right or no wrong on catching the falling knife. If you want to catch wait for the bullish sign first.
Manage your risk.
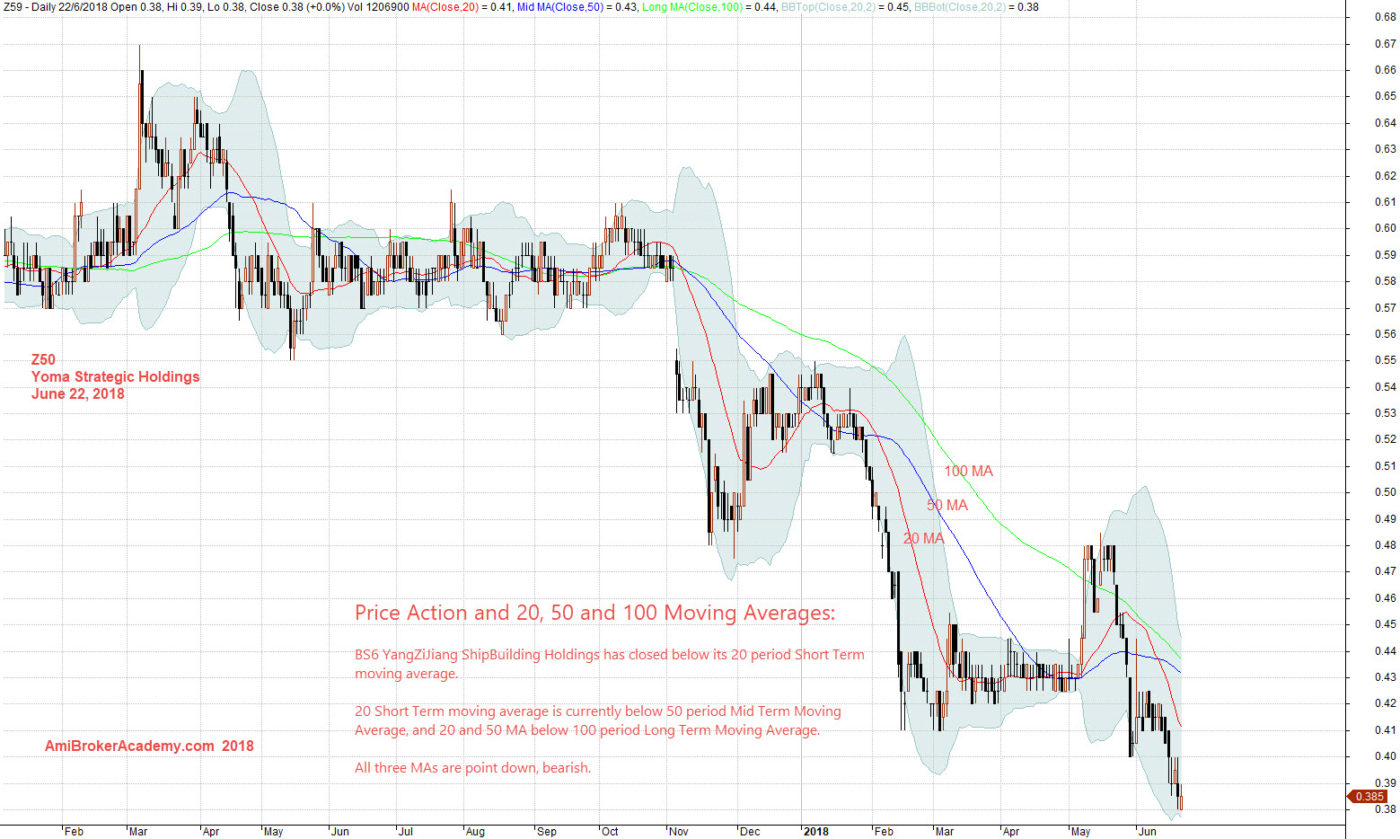
June 22, 2018 Yoma Strategic Holdings and MA
Z50 Yoma Strategic Holdings Stock Charting and MACD
Picture worth a thousand words, see chart.
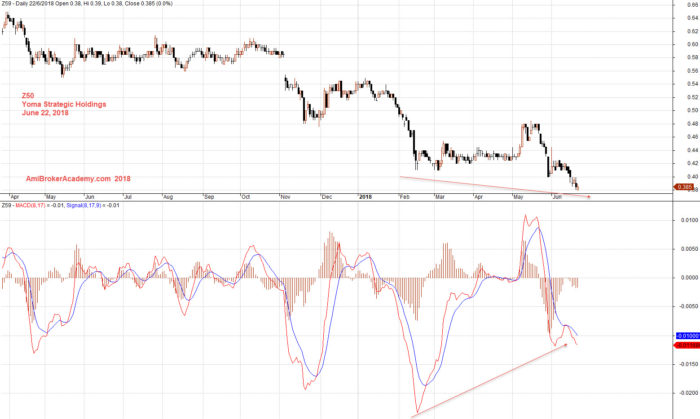
June 22, 2018 Yoma Strategic Holdings and MACD
Moses
AmiBrokerAcademy.com
Disclaimer
The above result is for illustration purpose. It is not meant to be used for buy or sell decision. We do not recommend any particular stocks. If particular stocks of such are mentioned, they are meant as demonstration of Amibroker as a powerful charting software and MACD. Amibroker can program to scan the stocks for buy and sell signals.
These are script generated signals. Not all scan results are shown here. The MACD signal should use with price action. Users must understand what MACD and price action are all about before using them. If necessary you should attend a course to learn more on Technical Analysis (TA) and Moving Average Convergence Divergence, MACD.
Once again, the website does not guarantee any results or investment return based on the information and instruction you have read here. It should be used as learning aids only and if you decide to trade real money, all trading decision should be your own.