25 February 2021
Welcome!
Welcome to AmiBroker Academy dot com, amibrokeracademy.com.
Z | Zillow Group, Inc. and River Stock Charting
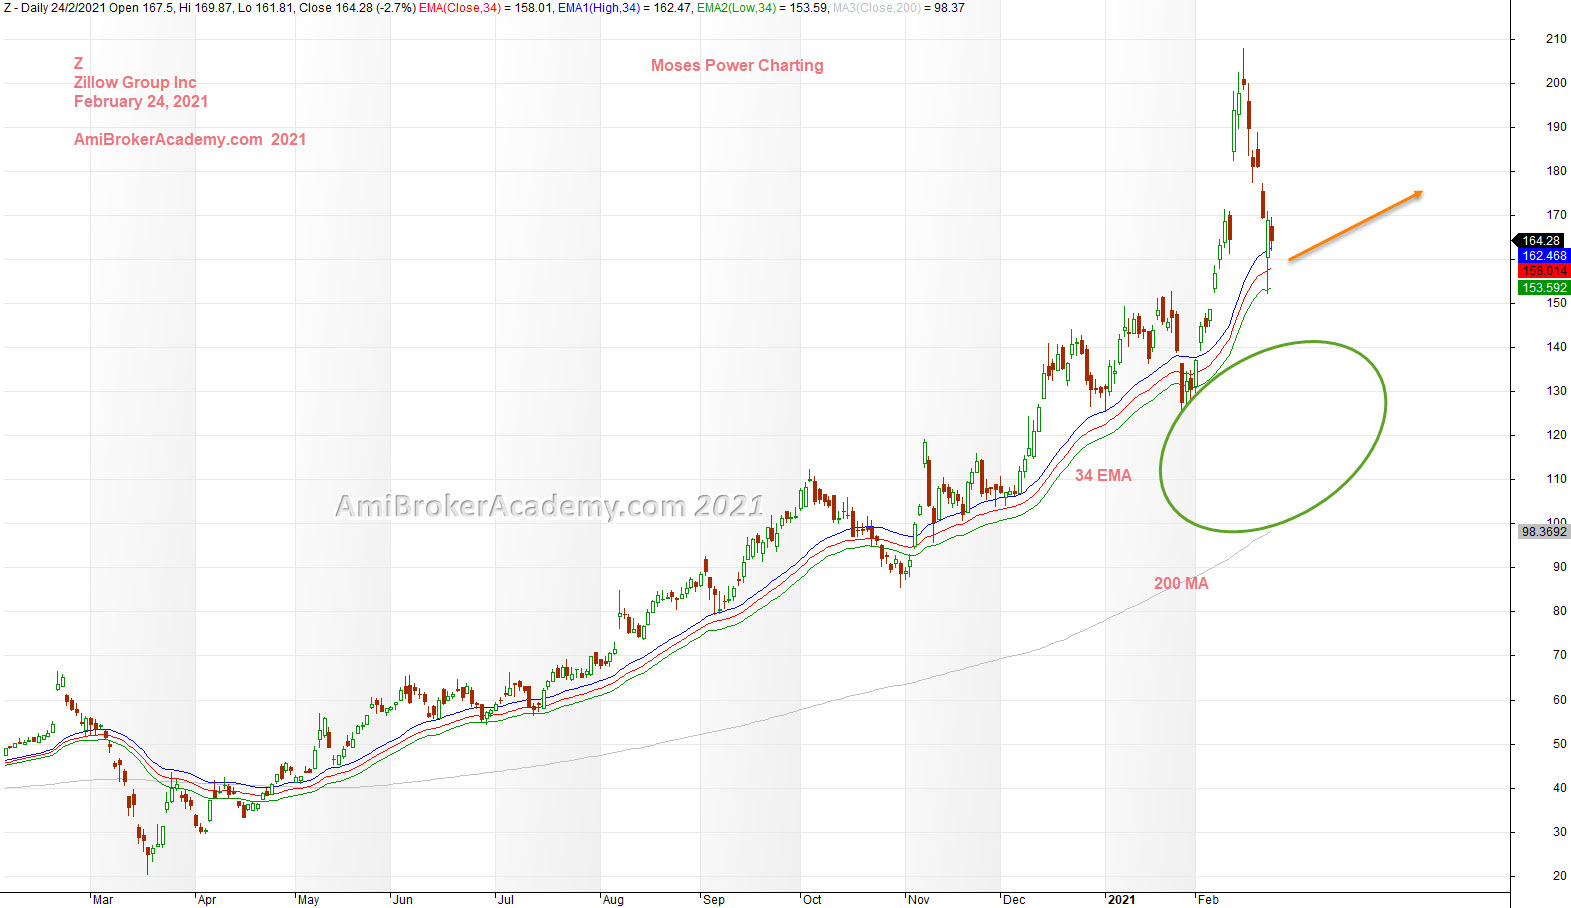
Study Zillow Group, Inc.and River stock price charting.
Price Action breakout above 34 EMA band, or River and stay above. 34 EMA is above 200 MA and slopping up. MA slops up, bull bias.
34 EMA, and 200 MA are wide open, see the “egg” in between the MAs.
Manage your risk.
Have fun!
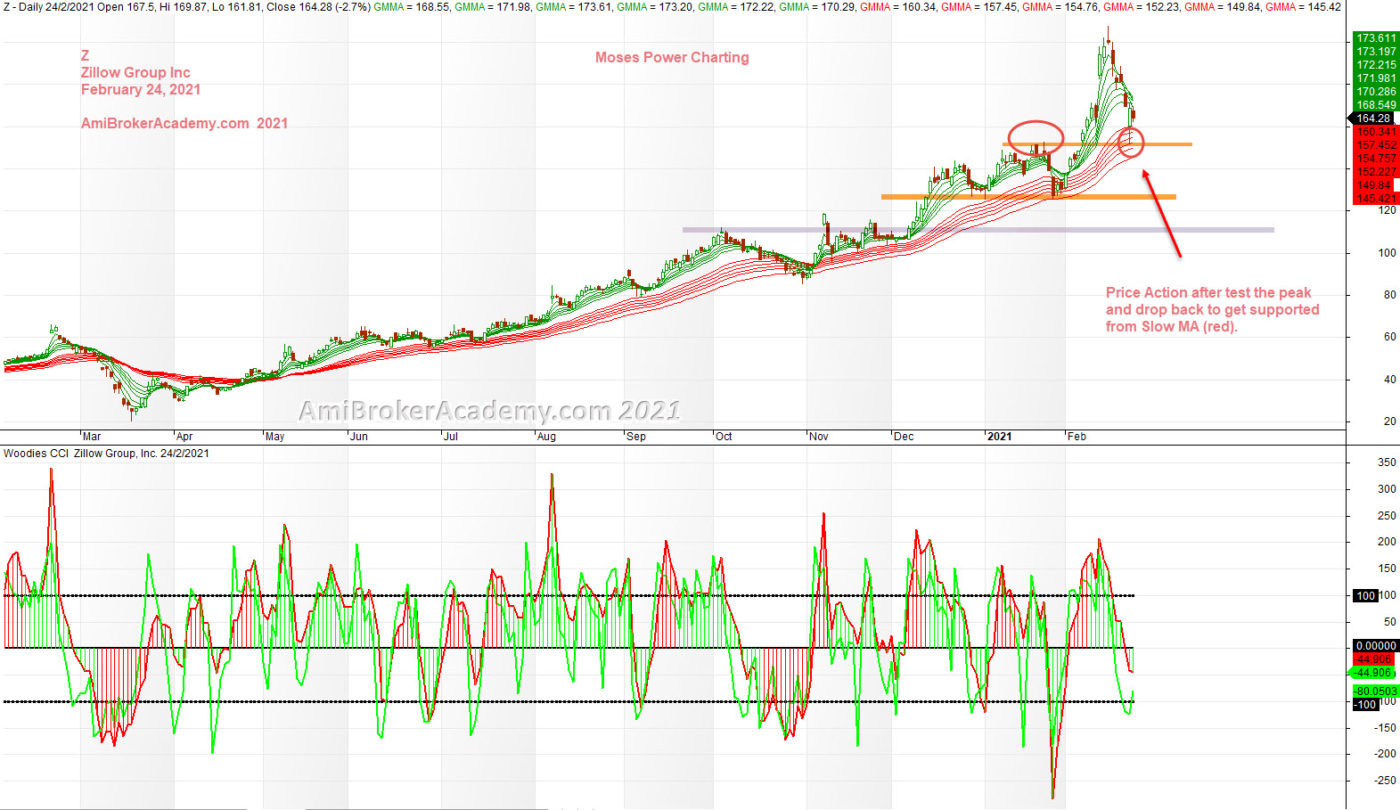
Z | Zillow Group, Inc.and GMMA and Woodies CCI Charting
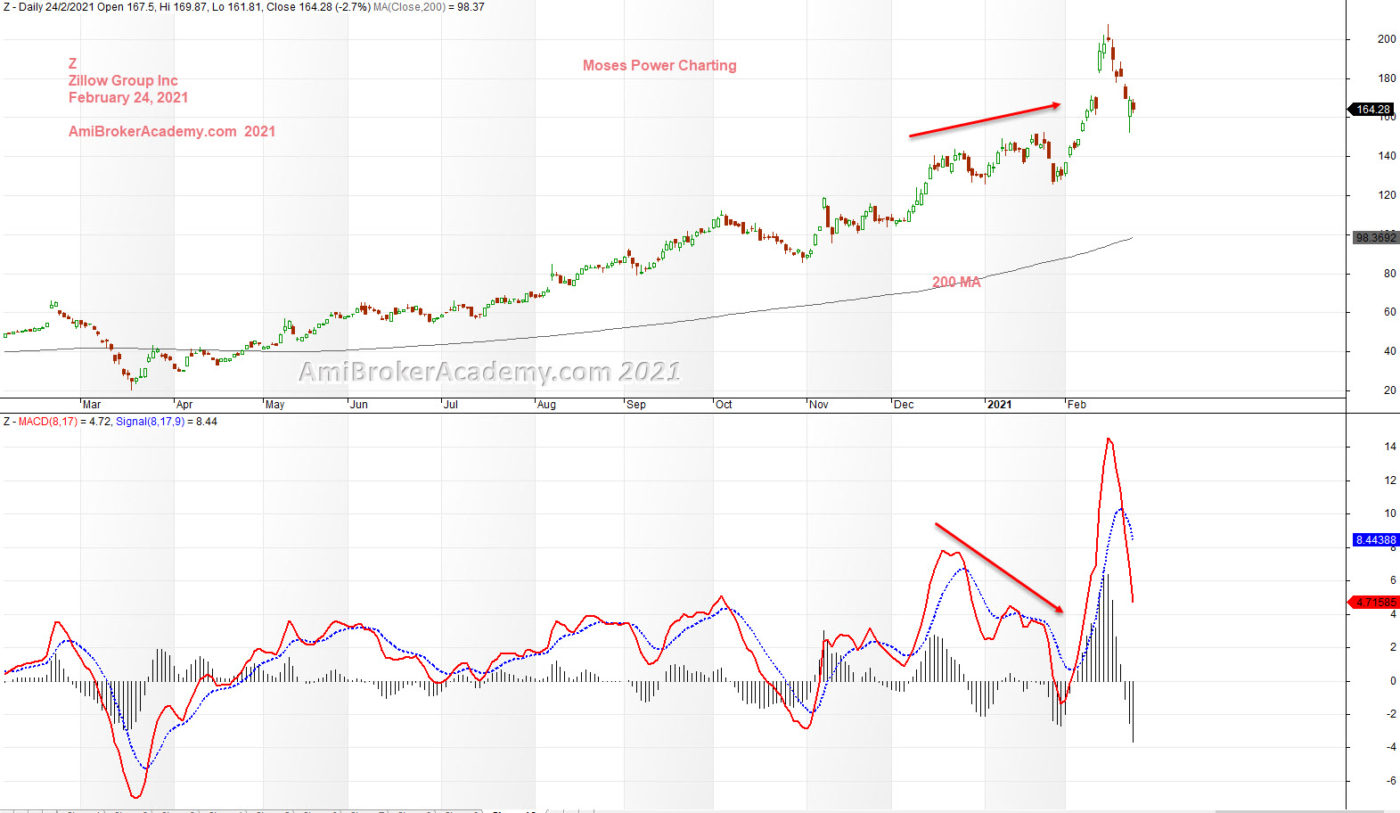
Z | Zillow Group, Inc. and MACD Charting
Moses Free Stock Charting
Official AmiBrokerAcademy.com Charting
Disclaimer
The above result is for illustration purpose. It is not meant to be used for buy or sell decision. We do not recommend any particular stocks. If particular stocks of such are mentioned, they are meant as demonstration of Amibroker as a powerful charting software and MACD. Amibroker can program to scan the stocks for buy and sell signals.
These are script generated signals. Not all scan results are shown here. The MACD signal should use with price action. Users must understand what MACD and price action are all about before using them. If necessary you should attend a course to learn more on Technical Analysis (TA) and Moving Average Convergence Divergence, MACD.
Once again, the website does not guarantee any results or investment return based on the information and instruction you have read here. It should be used as learning aids only and if you decide to trade real money, all trading decision should be your own.
We learn from many past and present great traders. Kudo to these master.