May 13, 2017
Friday, The Straits Times Index (STI) ended 15.82 points or 0.48% lower to 3255.29. Watch out next week, the index maybe pullback and go lower further.
Yeo Hiap Seng Stock Chart and Support Resistance
Picture worth a thousand words. See the chart below, Yeo Hiap Seng Stock Chart
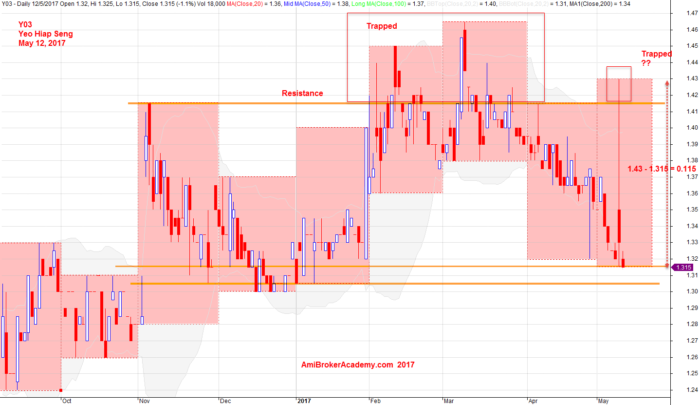
May 12, 2017 Yeo Hiap Seng and Support Resistance
Y03 Charting and 34 EMA Wave
Picture worth a thousand words. Price action close below 34 EMA Wave and continue to trace near 34 EMA Wave. Moving Average is a great visual tool. EMA Wave is slopping down, at 4 o’clock direction. The price action is still down, so what? You know better than me. Watchout.
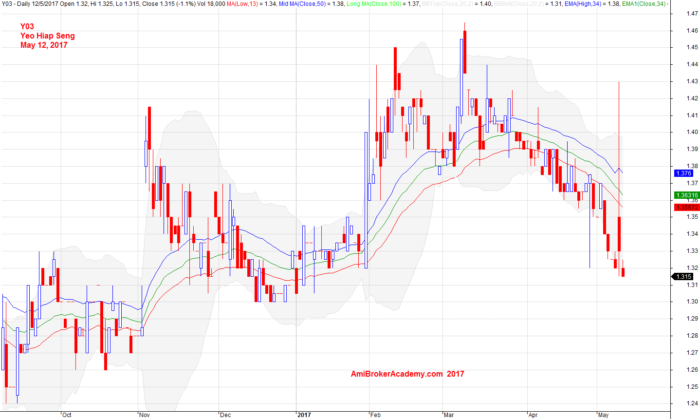
May 12, 2017 Yeo Hiap Seng and EMA Wave
Moses Stock Analysis
AmiBrokerAcademy.com
Disclaimer
The above result is for illustration purpose. It is not meant to be used for buy or sell decision. We do not recommend any particular stocks. If particular stocks of such are mentioned, they are meant as demonstration of Amibroker as a powerful charting software and MACD. Amibroker can program to scan the stocks for buy and sell signals.
These are script generated signals. Not all scan results are shown here. The MACD signal should use with price action. Users must understand what MACD and price action are all about before using them. If necessary you should attend a course to learn more on Technical Analysis (TA) and Moving Average Convergence Divergence, MACD.
Once again, the website does not guarantee any results or investment return based on the information and instruction you have read here. It should be used as learning aids only and if you decide to trade real money, all trading decision should be your own.