21 January, 2020
Welcome to AmiBrokerAcademy.com. Thanks for visiting the site.
0268.HK Kingdee International Software Group Company 金蝶国际软件集团Stock Charting
Study Kingdee International Software Group Company 金蝶国际软件集团 Stock chart Price Action and Year High Low.
See chart, picture worth a thousand words.
Price Action goes from low to high and pullback when you see it from the year high. When review the low, price action continue to form higher low.
Trade with your eyes open.
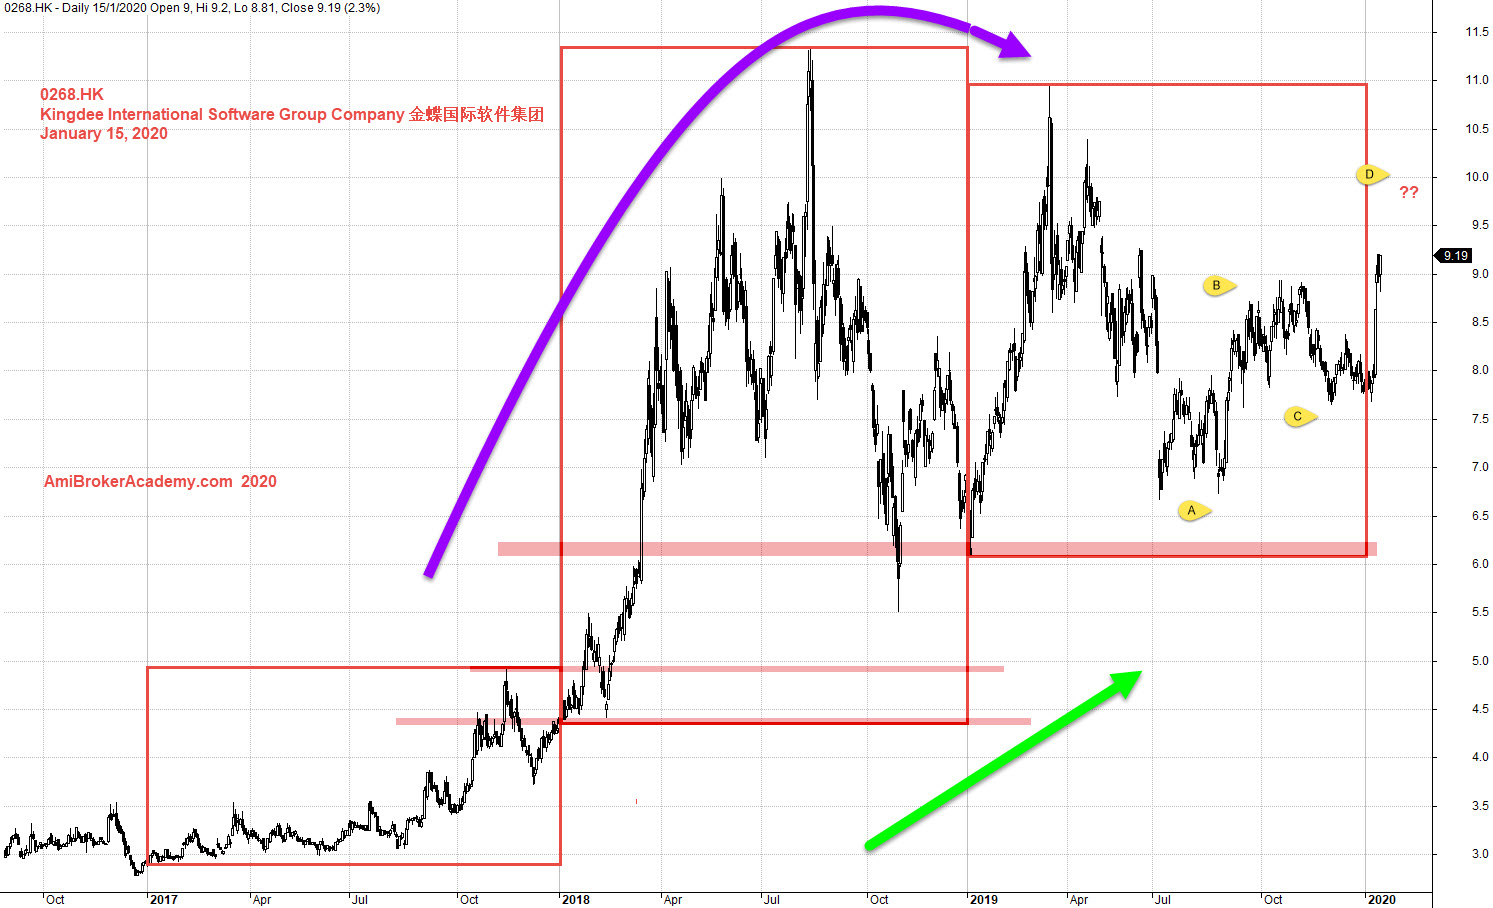
When you look at chart and the current affair, you will see looks like there is link between the trouble from end March last year. At least the price pullback after March.
Moses Stock Observation
AmiBrokerAcademy.com
Disclaimer
The above result is for illustration purpose. It is not meant to be used for buy or sell decision. We do not recommend any particular stocks. If particular stocks of such are mentioned, they are meant as demonstration of Amibroker as a powerful charting software and MACD. Amibroker can program to scan the stocks for buy and sell signals.
These are script generated signals. Not all scan results are shown here. The MACD signal should use with price action. Users must understand what MACD and price action are all about before using them. If necessary you should attend a course to learn more on Technical Analysis (TA) and Moving Average Convergence Divergence, MACD.
Once again, the website does not guarantee any results or investment return based on the information and instruction you have read here. It should be used as learning aids only and if you decide to trade real money, all trading decision should be your own.