May 5, 2017
Is It Time to Take Profit?
This is the question that all traders want to know … when the heck should I exit to either take profit or get out?
GOOG Alphabet Inc aka Google Charting Support Resistance
The stock price breakout higher three months resistance. See chart for more.
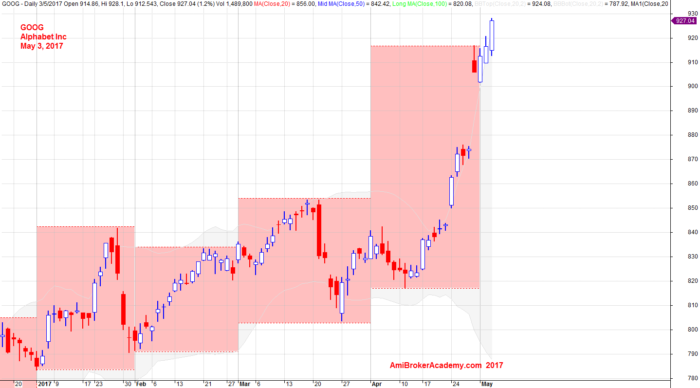
May 3, 2017 Alphabet Inc Support Resistance
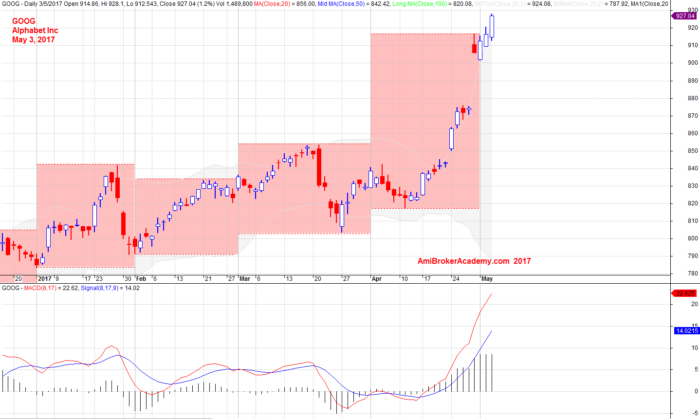
GOOG Alphabet Inc aka Google Charting and MACD Indicator
The price breakout three months high, or resistance. Will the breakout become trapped? Will see.
Alphabet stock has been on the bullish in 2007, the price starts from bottom left to top right. Picture worth a thousand words.
May 3, 2017 Alphabet Inc (aka Google) Monthly High Low
Alphabet Inc aka Google Charting 2005 to 2017
The stock price is approaching $1000. Will the stock price breakout higher than $1000? The price will need to pullback before it can move higher. Will see.
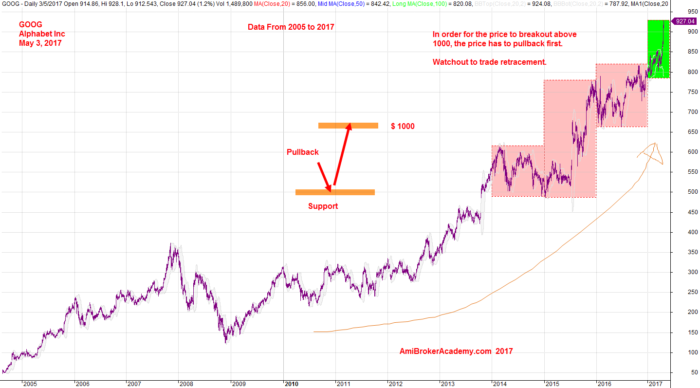
May 3, 2017 Alphabet Inc 2005 to 2017
Alphabet Inc aka Google Charting 2014 to 2017
In the chart below, the stock keep breakout higher each year. Picture worth a thousand words.
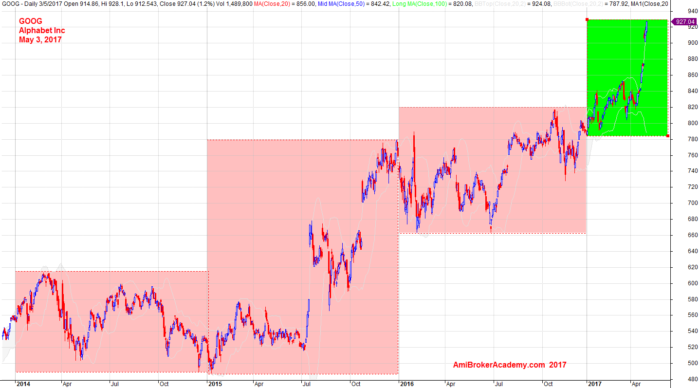
May 3, 2017 Alphabet Inc 2014 to 2017
The analysis here is intended to be a tutorial. We look at the chart from different views. We mainly study the popular stocks in US market and Singapore. Hope you can learn something. There is no right no wrong.
Moses Stock Analysis
AmiBrokerAcademy.com
Disclaimer
The above result is for illustration purpose. It is not meant to be used for buy or sell decision. We do not recommend any particular stocks. If particular stocks of such are mentioned, they are meant as demonstration of Amibroker as a powerful charting software and MACD. Amibroker can program to scan the stocks for buy and sell signals.
These are script generated signals. Not all scan results are shown here. The MACD signal should use with price action. Users must understand what MACD and price action are all about before using them. If necessary you should attend a course to learn more on Technical Analysis (TA) and Moving Average Convergence Divergence, MACD.
Once again, the website does not guarantee any results or investment return based on the information and instruction you have read here. It should be used as learning aids only and if you decide to trade real money, all trading decision should be your own.