November 17, 2018
Thanks for visiting the site.
AAPL Apple Inc Daily Charting
We believe in Buy Low Sell High
In other words Buy Support Sell Resistance
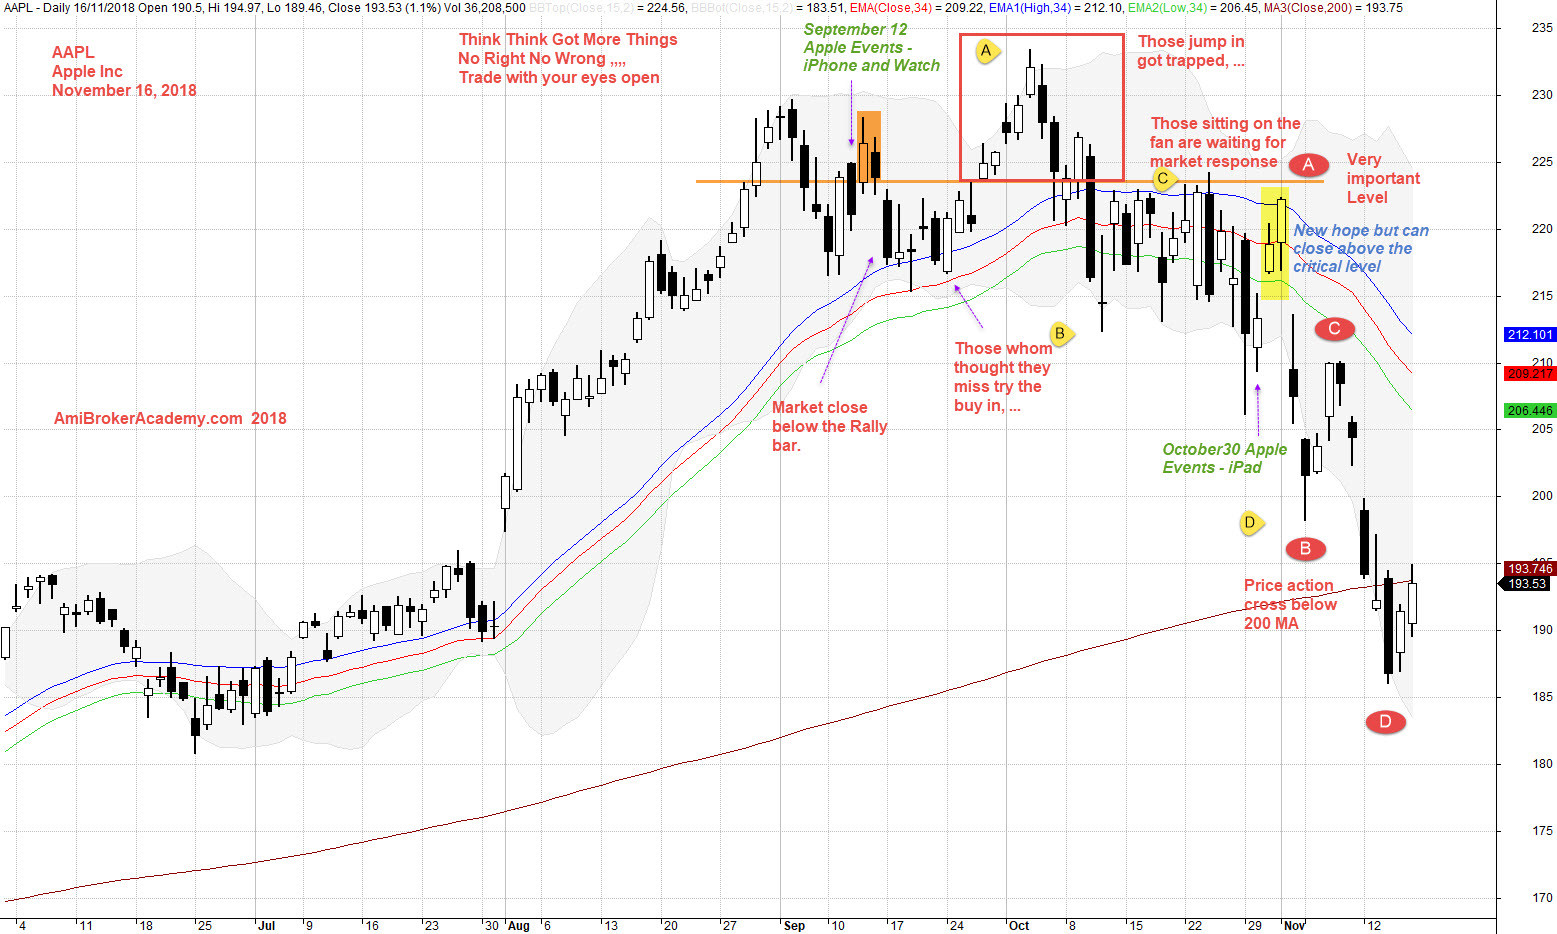
Study Apple Inc stock chart. You need to equip with a silk to read the chart on what is the important level beside support and resistance. Study the following chart carefully. If you do not get it, just keep repeat to read the comments over and over. You will get it at some point in time. Have fun learning.
Remember to trade with eyes open.
Think think got more things. No right no wrong, try to understand the candlestick represent on the market emotion. The critical information is all inside the candlestick pattern. Although you can not make money over candlestick pattern, see chart. H M Gartley 222 give you the clue on the move.
Trade with your eyes open. This is a hard to come by example. Save this positing if you can.
Manage your risk.
November 16, 2018 Apple Inc Stock Price After 2018 Products Rollout
if you can see the full chart, “press Ctrl and -” to zoom out and see the entire chart.
Study the chart using a great visual tool, moving averages. See chart, picture worth a thousand words. Trade with eyes open.
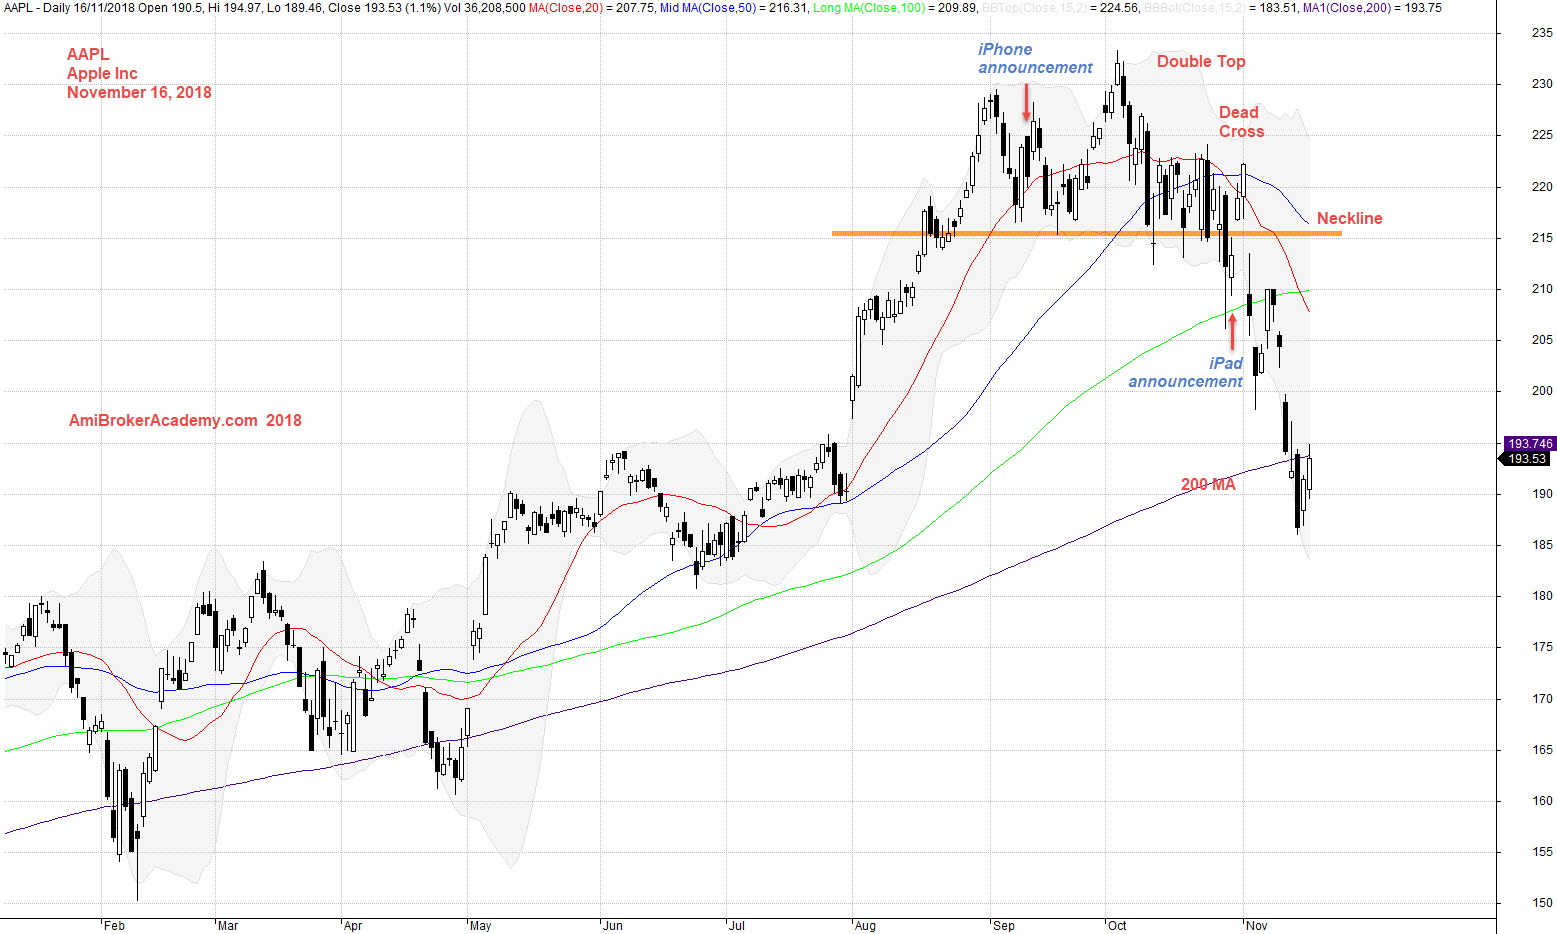
November 16, 2018 Apple Inc and Moving Averages
Imagine you add MACD indicator, the information on the trend is there, see char. Picture worth a thousand words.

November 16, 2018 Apple Inc and MACD
Moses US Stock Chart Analysis
AmiBrokerAcademy.com
Disclaimer
The above result is for illustration purpose. It is not meant to be used for buy or sell decision. We do not recommend any particular stocks. If particular stocks of such are mentioned, they are meant as demonstration of Amibroker as a powerful charting software and MACD. Amibroker can program to scan the stocks for buy and sell signals.
These are script generated signals. Not all scan results are shown here. The MACD signal should use with price action. Users must understand what MACD and price action are all about before using them. If necessary you should attend a course to learn more on Technical Analysis (TA) and Moving Average Convergence Divergence, MACD.
Once again, the website does not guarantee any results or investment return based on the information and instruction you have read here. It should be used as learning aids only and if you decide to trade real money, all trading decision should be your own.