19 July 2021
Welcome!
Welcome to AmiBroker Academy dot com, amibrokeracademy.com.
We bench mark two stock stock price of its price action. If you are our great follower, you will see many examples, we sometime benchmark two semiconductor companies, or such as Alpha and Omega Semiconductor a chip design and marketing company, and cryptocurrency, like Bitcoin, the world first cryptocurrency. Besides that we use other tools such as 1) Ichimoku Cloud, 2) Support Resistance (using box), 3) River (moving average), 4) GMMA and Woodies CCI, 5) Bollinger Bands and Moving Averages, and 6) MACD to analyze chart. See our simple reading of price action.
We translate price action chart into layman language. This will help you in understand the financial instrument you are trading. We believe picture worth a thousand words. So, sometimes we use less words. You can learn the price action interpretation too. Give it a tray. You may not have the same view points as us. Remember all analysis read price action chart differently. It is just like reading an essay, we will have different conclusion.
Trade well.
Trade what you see. Manage your risk.
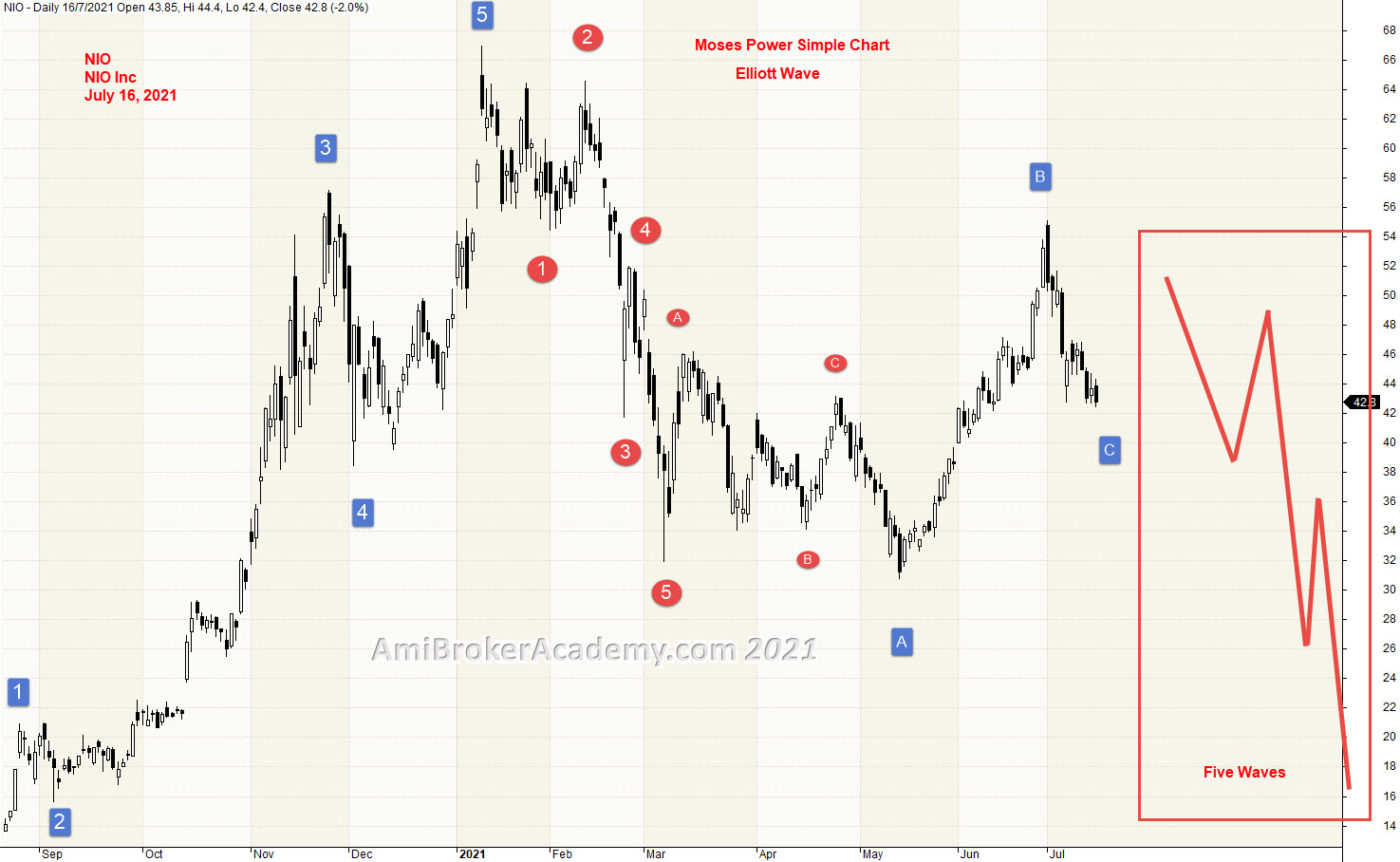
Elliott Waves

Ralph Nelson Elliott a professional accountant, after analyzing close to 75 years worth of stock data, Elliott discovered that stock markets, thought to behave in a somewhat chaotic manner, actually didn’t.
At 66 years old, he finally concluded enough evidence and confidence to share his discovery with the world. He published his theory in the book entitled The Wave Principle.
1) NIO Inc and Elliott Waves
We study price action using wave pattern, we see NIO Inc price action, price action begin to go from low at bottom left to high and pullback. Price Action after test the support and begin to return high again. Why counting the waves? One very simple reason is to predict the entry or project the profit taking.
Trade what you see.
Remember, we just read what the chart said. We just mark the wave accordingly. Have fun!
Moses Power Charting
Official AmiBrokerAcademy.com Charting
Disclaimer
The above result is for illustration purpose. It is not meant to be used for buy or sell decision. We do not recommend any particular stocks. If particular stocks of such are mentioned, they are meant as demonstration of Amibroker as a powerful charting software and MACD. Amibroker can program to scan the stocks for buy and sell signals.
These are script generated signals. Not all scan results are shown here. The MACD signal should use with price action. Users must understand what MACD and price action are all about before using them. If necessary you should attend a course to learn more on Technical Analysis (TA) and Moving Average Convergence Divergence, MACD.
Once again, the website does not guarantee any results or investment return based on the information and instruction you have read here. It should be used as learning aids only and if you decide to trade real money, all trading decision should be your own.
We learn from many past and present great traders. Kudo to these master.